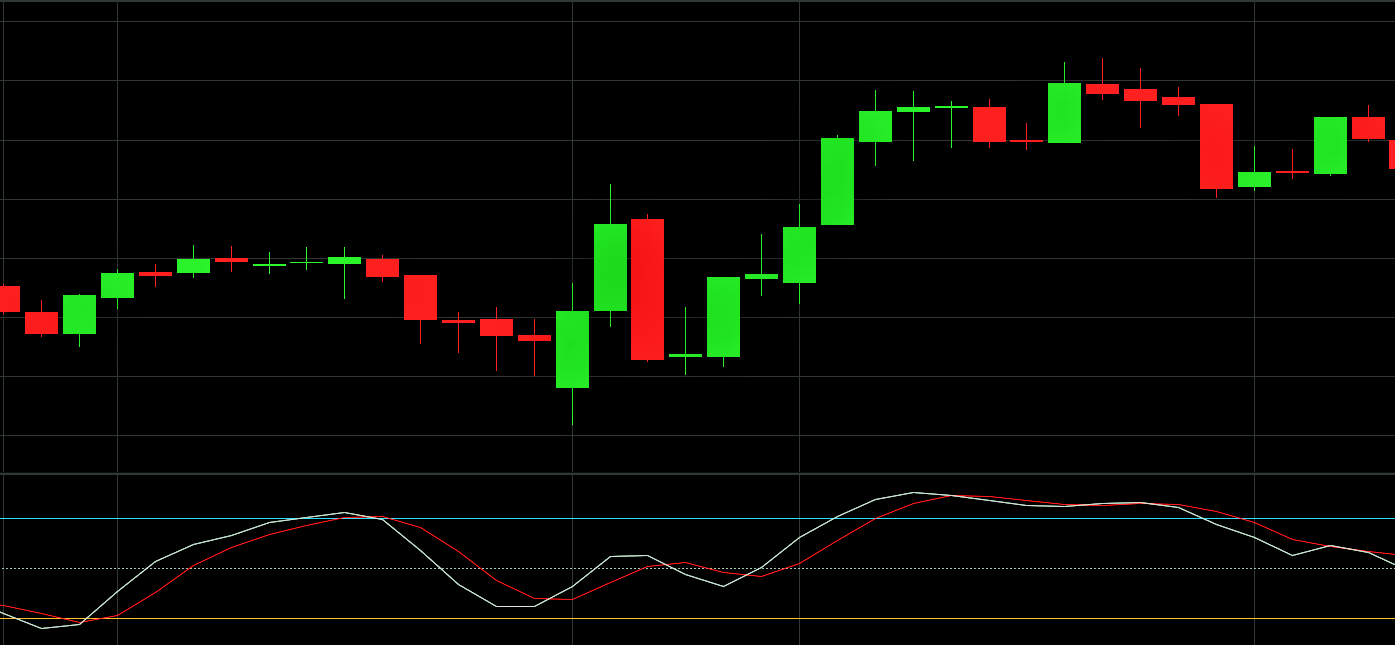
This example compares closing price with price range over a given time period to identify overbought and oversold situations.
This momentum indicator works on the basic assumptions that in an uptrend, today’s closing price is likely to be close to the highest recent close price, and that in a downtrend, today’s closing price is likely to be close to the lowest recent close price.
Stochastic oscillators display two lines: %K, and %D. The %K line compares the lowest low and the highest high of a given period to define a price range, then displays the last closing price as a percentage of this range. The %D line is a moving average of %K.
These two lines are shown on a scale of 1 to 100 with key trigger levels shown at 20 and 80. These lines are represented by a blue and an orange line. Any action outside these lines is considered to be particularly significant.
A stochastic study is useful when monitoring fast markets. However, its speed means that it should be used in conjunction with other indicators to confirm any signals, such as a stochastic RSI. If you want a more conservative equivalent, use the slow stochastic.
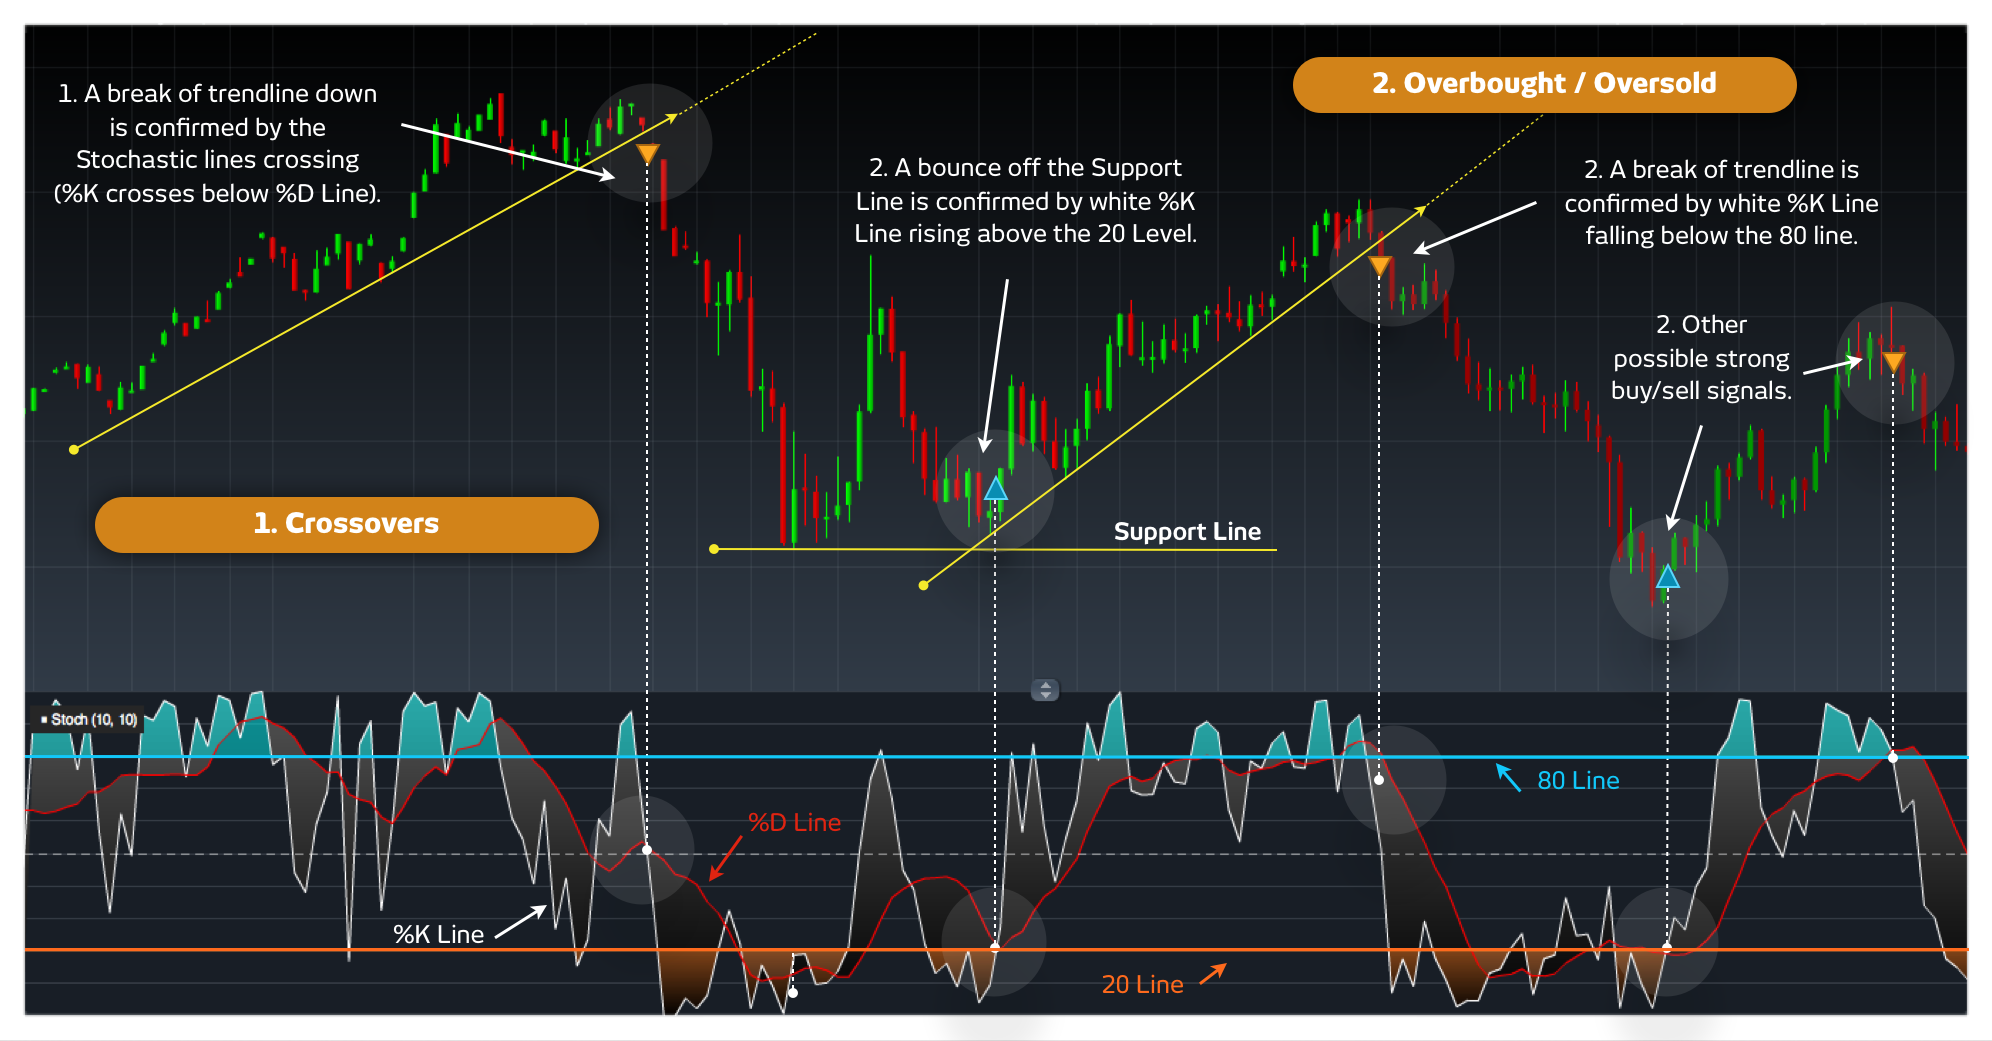
As with moving averages, when the two stochastic lines (%K and %D) cross, a signal is generated. If the white %K line crosses below the red %D line, a possible sell signal is generated. If the red %D line crosses below the white %K line, a possible buy signal is generated. These crossovers may appear anywhere on the study, but signals above the lines at 20 and 80 are considered to be stronger.
When the stochastic %K line crosses the 80 line, the product is considered to be overbought. When it crosses the 20 line, the product is considered to be oversold. However, in a strongly trending market the line may remain in this region for some time, so some traders consider the line moving back out of this zone as the confirmation of the end of a trend.
