Trading patterns
Recognising trading patterns is one of the most versatile skills you can learn when it comes to trading. This is the branch of technical analysis that focuses on finding price (and often volume) patterns. Trading using price action can help you to identify shifts between rising and falling trends. Traders look for price patterns that signal changes in the market’s trend, and then execute trades based on these signals. Trading patterns can also be used to forecast market reversals and trend continuations.
The key is to spend time learning the basic rules so you can use these methods most effectively with your trading strategy. See our stock chart patterns guide for a comprehensive overview of the 11 most important chart patterns you may come across.
While the idea of trading patterns may seem strange, it's based on carefully tested methods which underline their usefulness to traders. Importantly, patterns are factors to consider when calculating where to enter, set stop-loss orders, and where to set your profit targets. These factors are, of course, some of the key things that all traders will wish to consider when managing their overall portfolio.
- Recognise how price movements can develop into price patterns
- Isolate sensible entry points
- Manage risk with stop losses and set profit targets
Types of trading patterns
Trading pattern recognition comes from looking for patterns that appear in the prices of traded instruments. You should be looking for shapes such as triangles, rectangles and diamonds. While this may not inspire confidence at the outset, these are formations that arise and track the changes in support and resistance. There are also more complex trading patterns such as head and shoulders, cup and handle and double tops/bottoms.
Once you have learned these skills, you will be able to apply them in any financial market that you choose, from shares to indices and forex. Pattern recognition can form the basis of trading strategies for day traders, swing traders and longer-term position traders alike and can be applied to anything from five-minute to weekly charts.
Rectangles and, in particular, triangles, have a wide number of varieties that can be used. In essence, all price patterns are looking at the interaction of supply and demand over time and establishing sensible ways in which to react when these trading patterns form. This means you will know how you to react in terms of risk management and closing out.
Triangle trading patterns
There are several different types of triangles which can all be very effective for your trading. One advantage is that there is no bias to either the long or short side, and this makes them very useful from the perspective of a CFD trader. Keep in mind that if you are always biasing yourself to the long side of the market, then you could be missing out on some of the most attractive features of this pattern.
Triangles are patterns inside which the price consolidates. However, because there is no long or short side bias, you must keep an eye on triangles for when an eventual breakout occurs. There are two broad categories of triangle that form:
- The ascending and descending triangle (the opposite of one another)
- The symmetrical triangle
Ascending triangle
The ascending triangle is possibly the best recognised trading pattern in this category, as it incorporates the use of a resistance line (which traders are frequently on the lookout for) and a rising support line.
The important parts of this formation are the two lines marked in red: the resistance line and uptrend line. You should be mindful of trading volumes during the formation of the pattern, and then how volumes are affected when the breakout occurs.

Typically, you would look for volume levels to decline over the time that the pattern forms. One way to think about this decline is that buyers and sellers gradually get pushed into a narrower and narrower balance of support and resistance, which effectively drives out the interest until price can break out and begin to trend once more. If volume isn't declining, this doesn't necessarily mean that there is a problem with the pattern; however, something you should be on the lookout for is a volume spike when the breakout occurs. This tends to have a beneficial effect on the overall strength of the pattern from then on.
Another effect that can be greatly beneficial to look out for when breakouts occur is a gap in the price. This shows a surge in demand for the instrument (surge in supply if it's a short trade) which adds a great deal of price confirmation for the trader. Traders may sometimes be put off by this because they feel the trade has got away from them, but in reality this is likely to be reinforcement that you have correctly determined a breakout is occurring.
Something that traders all fear when it comes to breakout pattern trades is what is known as the false breakout, or whipsaw. This occurs when price breaches the pattern, which may lead aggressive traders to move straight into the trade. Unfortunately, what happens in the case of the false breakout is that you get what seems to be a genuine signal, only to find out later that the price retreats back within the confines of the pattern, and you are left holding a trade that is not doing what you hoped it would.
The only way you can try to combat this is by applying a filter of some sort, and the most obvious method is to wait until there have been X closes outside of the pattern. If you are looking at daily charts, then you may decide to wait until the price has closed outside of the pattern for two days before entry. There are other means of avoiding this type of false breakout. Some traders choose to wait until the price has moved twice the average true range (2ATR) outside of the pattern. None of these methods will guarantee that you won't suffer false breakouts.
The previous chart demonstrated an example of an ascending triangle with an upward breakout. As there is no directional bias as to which way patterns are going to break out, we also need to look at an example of what a downward break on an ascending triangle looks like.

You can see that the basic setup is exactly the same, except the breakout occurs in the opposite direction which then necessitates a short trade. You should note that in the case of both these examples we have shown a retracement back to the line from which they broke out. This is something that can happen without the signal being considered a failure – however, you should not assume this will always happen. In fact, you would assume that the instances where this does not occur are when you're receiving the strongest signals.
Descending triangle
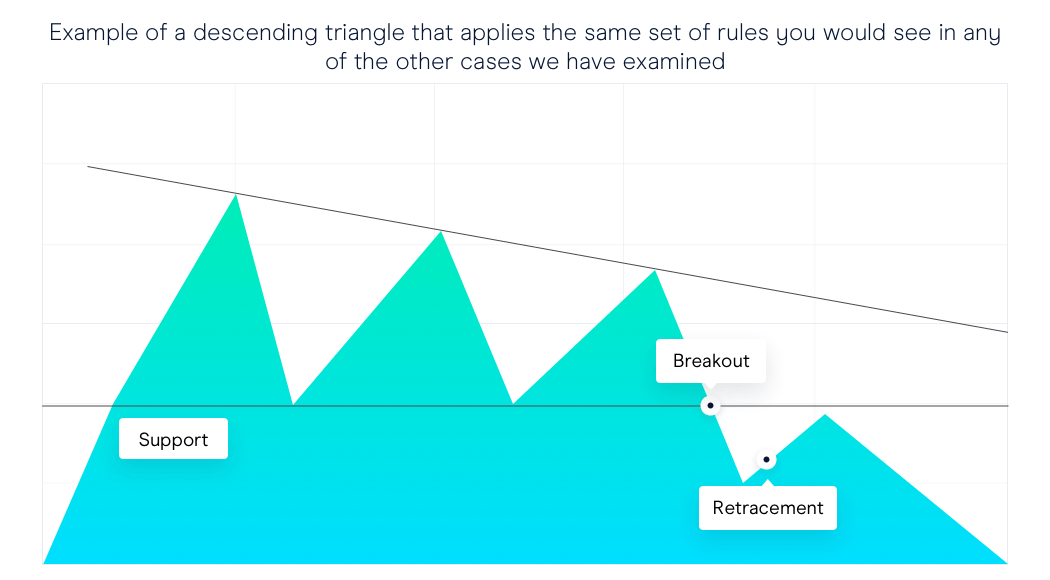
The flipside of the previously described ascending triangle is the descending triangle, which has very similar characteristics but sets itself up in the opposite direction. As with its ascending counterpart, the breakout can occur in either direction, so you need to watch the direction in which the breakout occurs.
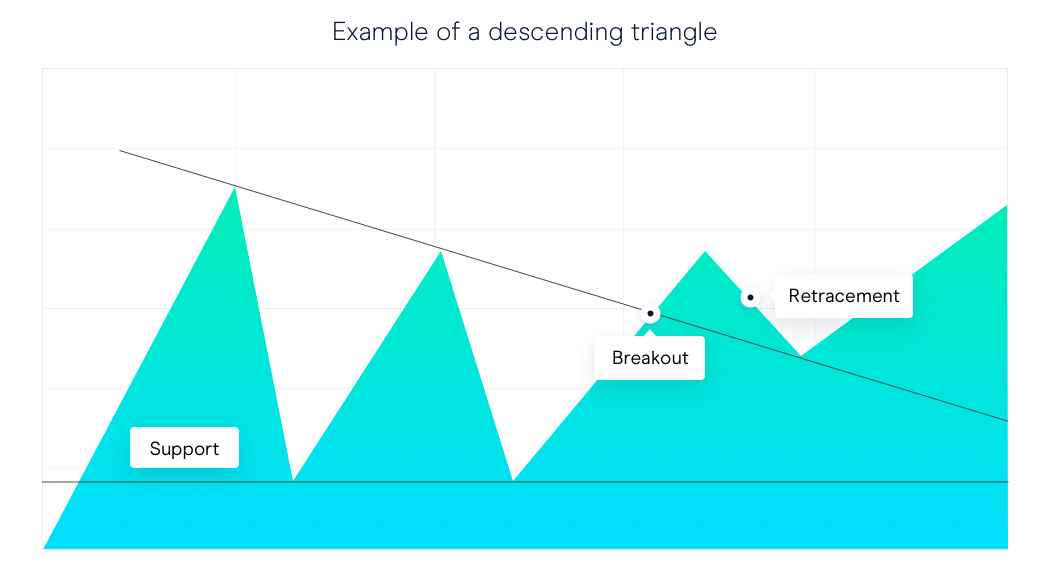
Some traders would suggest that the price should drive quite clearly from the support and resistance points and not spend too much time drifting sideways. And when it comes to triangle patterns, you would preferably see the price break out of the pattern before it reaches 75% of the way to the apex. This is because if the pattern continues sideways it's starting to lose momentum and may continue to drift sideways, which is far from what the breakout trader wants.
Symmetrical triangle
The symmetrical triangle has some characteristics in common with the ascending/descending triangle in that the price is being driven into a narrower band of price movement, and the trader is looking for a breakout of the price. In addition, you will probably see the level of trading volume in the instrument decline as it moves throughout the formation, and then subsequently rise significantly above the average when the breakout occurs.
As with other triangles, there is the possibility of false breakouts, so it's worth considering placing a filter on the breakout to reduce your chances of being exposed to a whipsaw entry into the trade. Again, this may be a set number of closes above the breakout level or, alternatively, using a filter like the average true range.
In these trades, as with any of the triangles, there are two main choices as to where stop-loss orders are placed. The more aggressive trader might place a stop just on the other side of the breakout line, where the whipsaw is likely to have occurred. This is as close as a stop-loss can realistically be placed, because otherwise you aren't really giving the trade a decent chance of success. The alternative and more conservative method is to put the stop on the far side of the pattern completely, which would show a total failure of the setup if that level is reached.
Rectangle trading patterns
Having looked at setups where the support and resistance levels are moving closer together, the rectangle setup shows where the two levels run parallel to one another. Although the trading pattern looks very different to any of the triangle family, the behaviours in terms of the setups are quite similar, in terms of the breakout and risk management.

This chart again illustrates the breakout having a subsequent throwback to what was the resistance line, but this will not always be the case. Like the triangle, the best outcome is a strong continuation from this level on high volume from the point of the breakout.
Flag trading patterns
Like the pennant, the flag is a shorter-term version of a similar pattern – in this case a channel. Flags require many of the same characteristics as the pennant in order to be confirmed as genuine. This trading pattern is only genuine if the breakout occurs in the same direction in which price entered it. You will also tend to see the direction of the flag move in the opposite direction of the prevailing price movement.
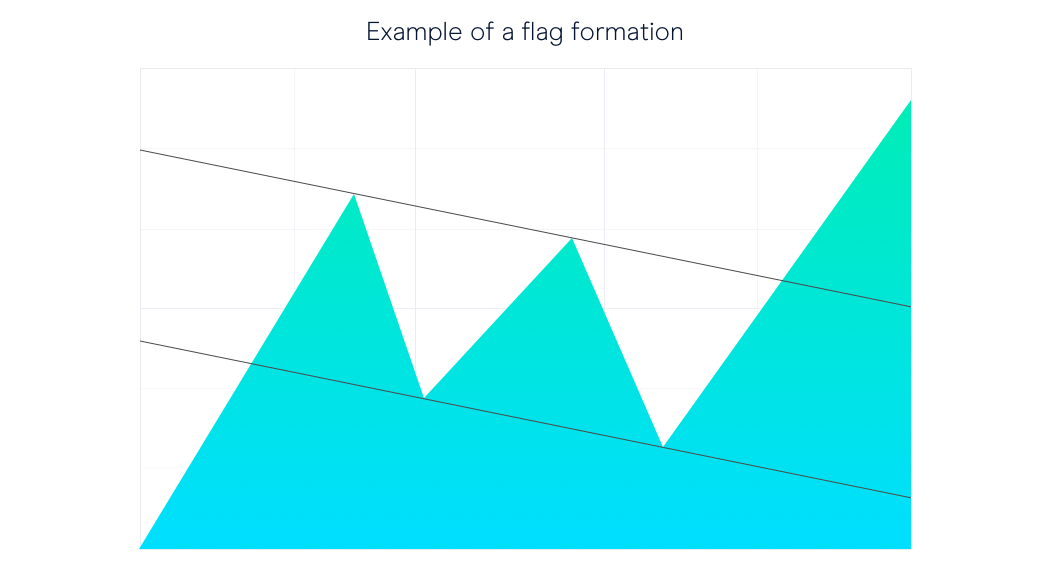
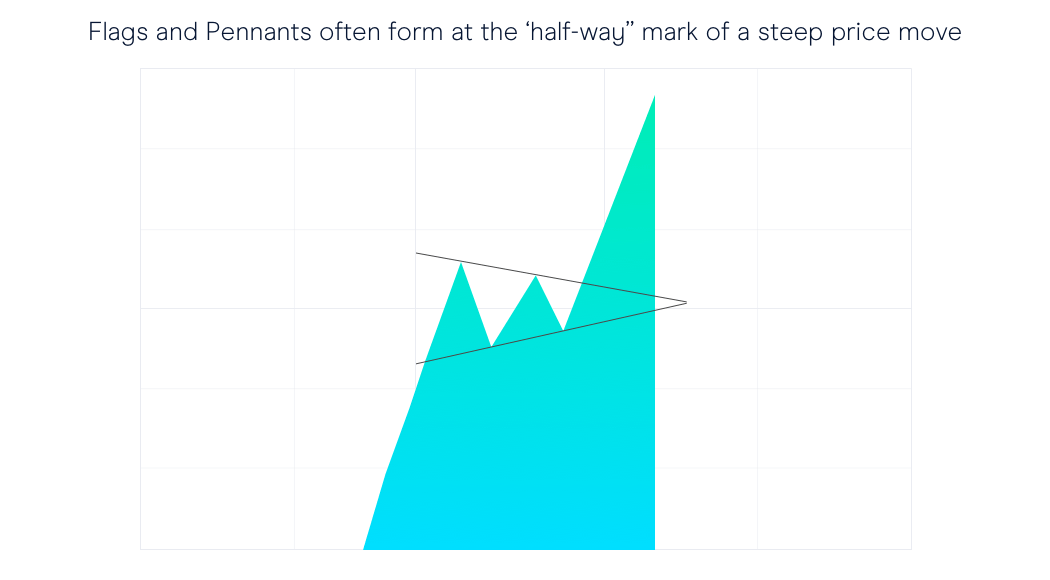
Both the flag and pennant occur after a sharp movement in price – this near-vertical price move forms the ‘flag pole’ on which the pennant or the flag occurs. It's important to see this in the lead-up because the pattern is not genuine without it. Lastly, you are likely to see a spike in volume in both cases on the breakout, which will add to the confirmation of the pattern.
The placement of stops obeys the same basic rules as above, with more aggressive traders closing trades at the first sign of failure, while a more conservative trader might look for a price to cross the pattern entirely before regarding it a failure.
Price targets
It's possible to use all the patterns discussed to target an eventual profit-taking point. In the case of the triangles and the rectangle, this is done easily by measuring the height of the pattern and then extrapolating the target out from the breakout point.
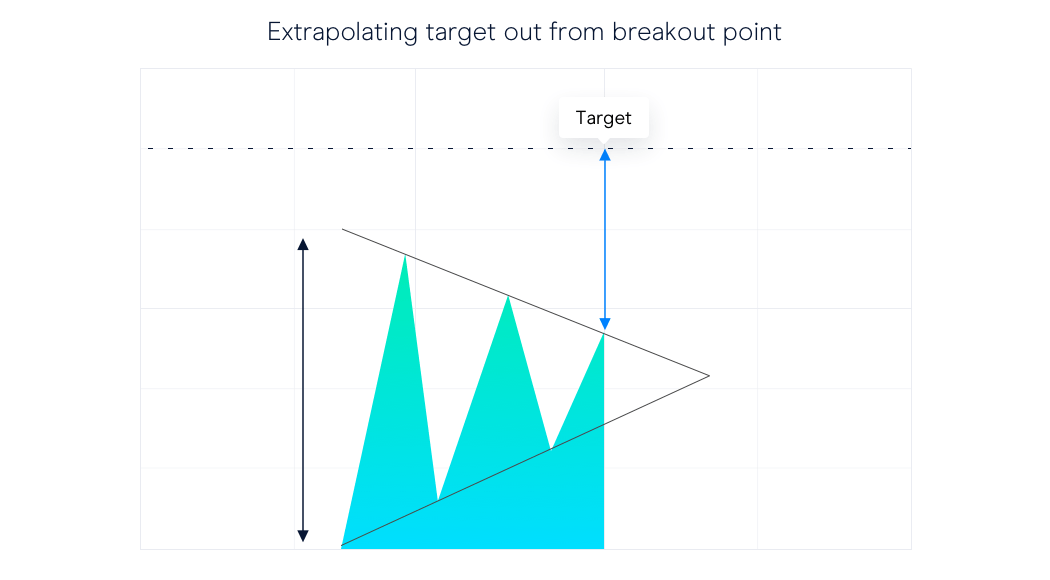
The same basic premise is applied to the rectangle. In the case of flags and pennants, the target is determined by measuring the height of the flagpole leading into the formation and then added on the way out. These formations are sometimes referred to as measuring formations because they often occur halfway through the price swing.
How to spot trading chart patterns
Luckily, you don’t have to manually identify and draw chart patterns when using our Next Generation trading platform. It includes our cutting edge chart pattern screener, which can identify trading patterns automatically, providing you with a great resource to inform your strategy. You can save time and effort whilst the pattern recognition scanner identifies all the best opportunities for you. This is one of many automated trading strategies.
Learn more about breakout stocks in the share market.
Summary
- You should recognise basic price conditions required for a pattern to be genuine
- You should know how to tell when a pattern has failed
- You should be able to generate a sensible risk-management plan in line with your pattern-recognition skill
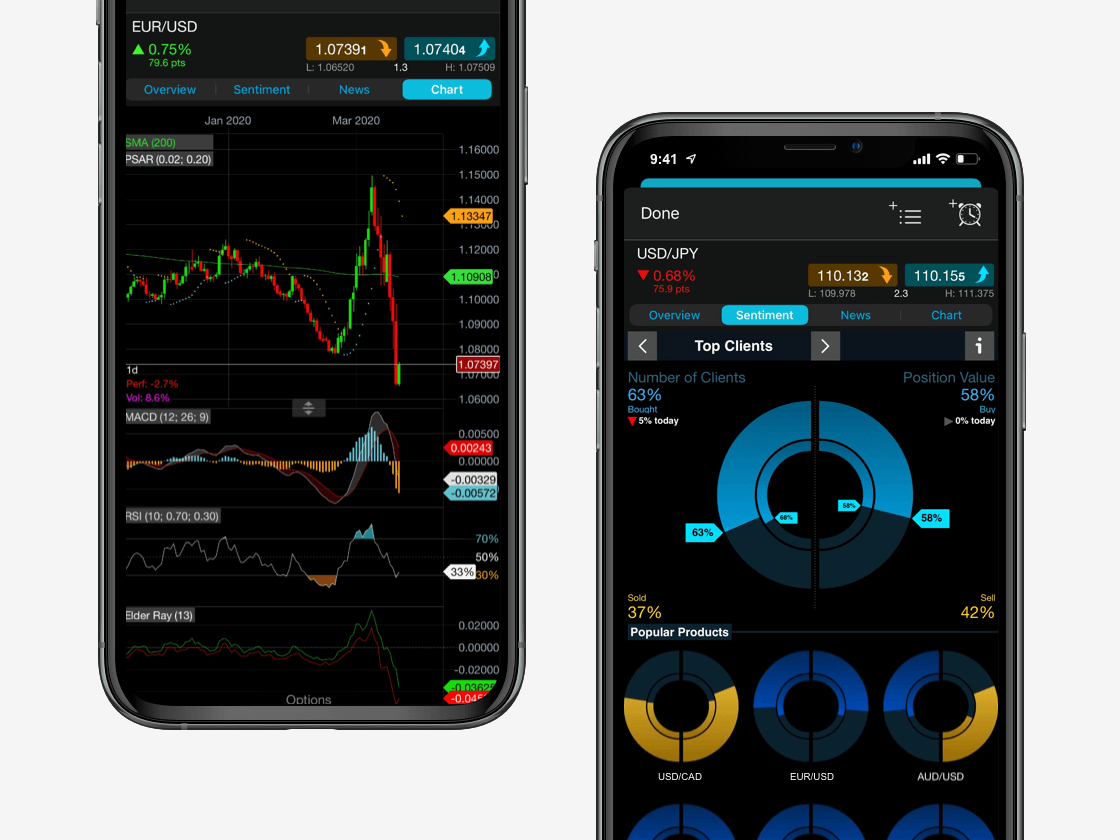
Seamlessly open and close trades, track your progress and set up alerts
