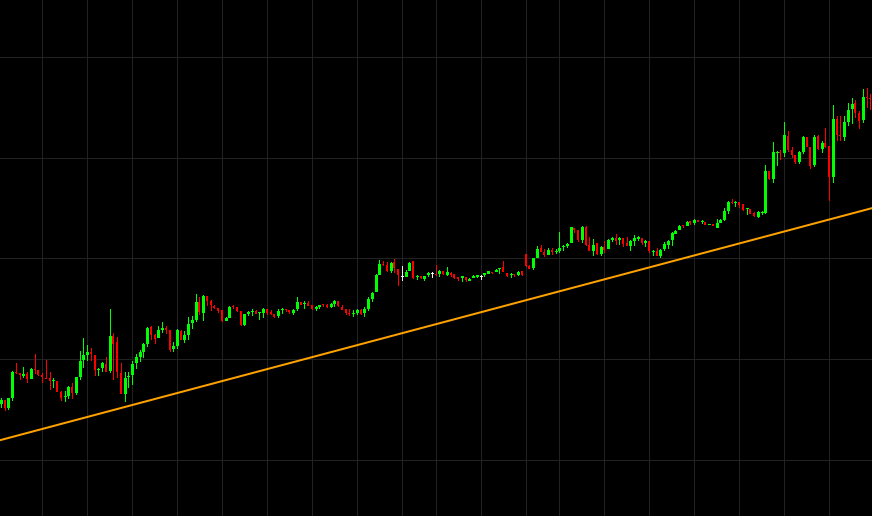
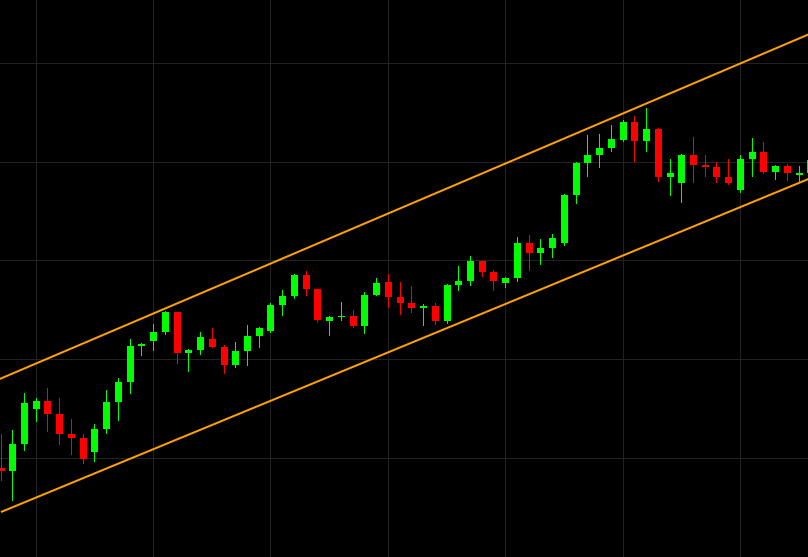
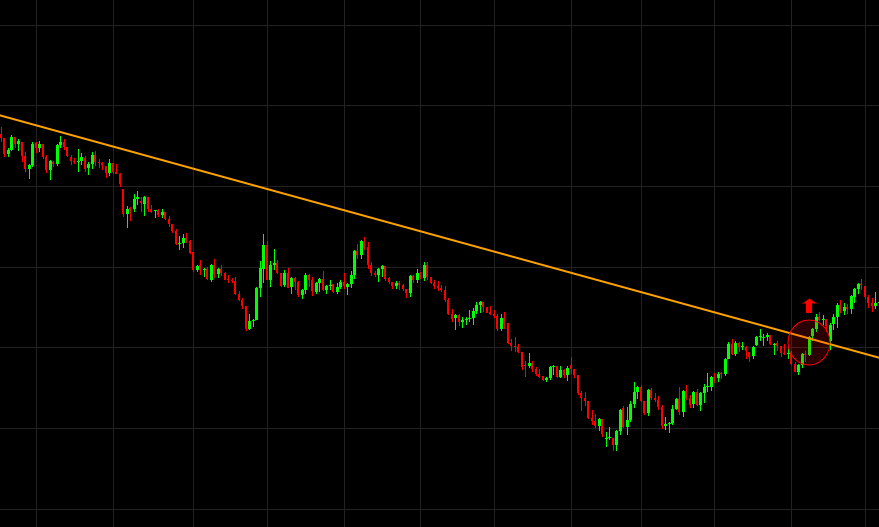
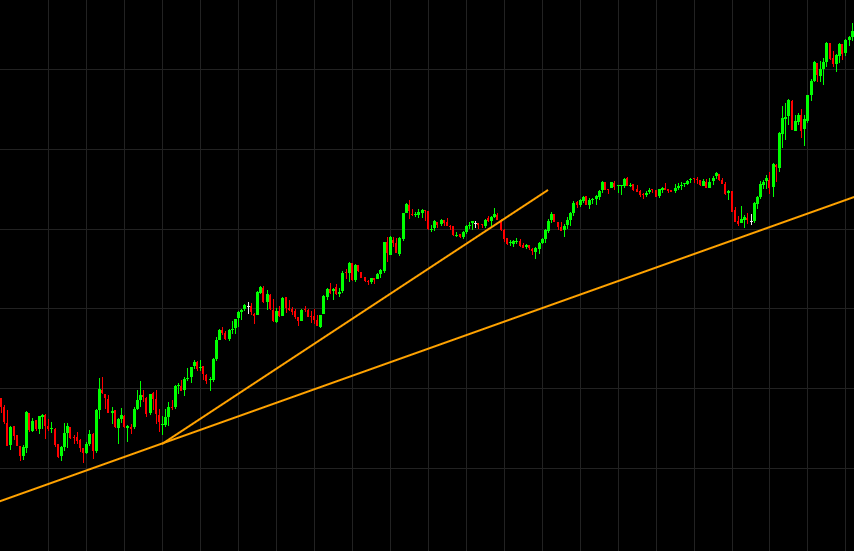
The troughs and peaks of trendlines represent support and resistance levels in a preferred period of time, which are driven by supply and demand of a security. Support highlights a price level on the candlestick chart that is under the current market price. If the buying interest of a security is strong enough to overcome selling pressure, the price will halt at this low point and start to rise again. Conversely, resistance highlights a price level on the chart that is above the current market price. This means that the price may start to fall again against an uptrend. Horizontal support and resistance levels are sometimes drawn when there is repetition of a price rising and falling to the same mark on the chart, to show that the market is struggling to move past this trend.
Trading with trendlines is useful in any financial market, whether this be forex, stocks, indices or commodities. However, some markets and assets are more volatile than others and this means that they may have less clear trendlines that fluctuate more often.
