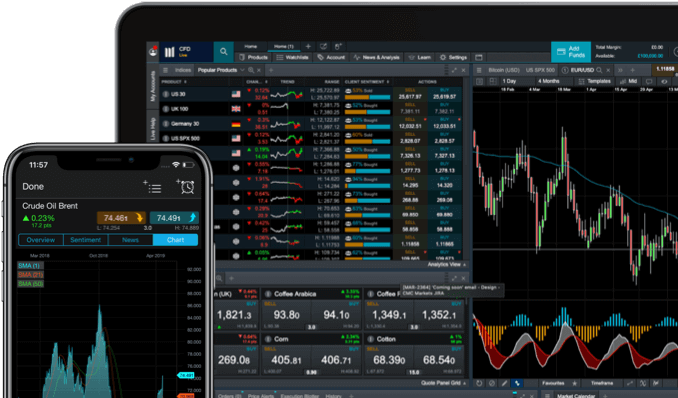
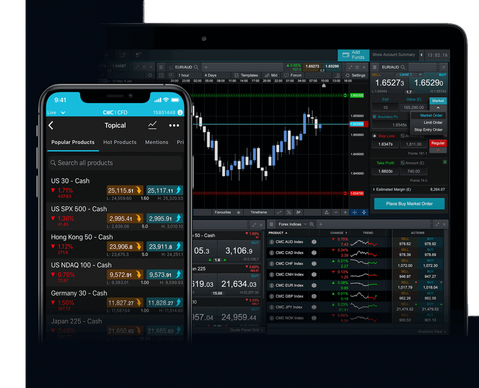
Traders use different time frame charts depending on a number of aspects, as follows:
Trade on different chart time frames
Many traders use price charts of their chosen instruments to figure out entry and exit signals, buy and sell points and where to set stop-loss and take profit orders. However, few traders consider what sort of timeframe they should be looking at. Choosing the right timeframe for charts is an important part of the process when building a trading plan.
The majority of short-term traders choose to focus on price charts with a narrower timeframe in order to analyse fluctuating price action within their market. This can be any interval between a few seconds to a few minutes, which can be particularly useful for short-term trading strategies. This article has been written with the aim of providing guidance on the time frame charts which may help you make an informed decision before spread betting or trading CFDs.
Different time frames in trading
- Trading strategy. This can include shorter-term strategies, such as scalping and day trading, or longer-term strategies, such as swing trading and position trading.
- Financial market. Some markets are more volatile than others, and therefore, there is more price action to study. Traders often use shorter time frame charts to analyse the forex and share markets, for example, as prices can jump and fall in a matter of seconds.
- Type of trading chart. Bar and candlestick charts can display granular data on a price chart more clearly, whereas line graphs and Renko charts help to show the overall direction of price trends with a smoothed out appearance.
Our online trading platform, Next Generation, allows you to view charts with as little as one-second intervals in order to make the most of fast-paced trades. Learn more about the types of trading charts that we offer.
One-minute chart trading strategy
A one-minute time frame chart may be ideal for a scalping strategy, where traders aim to make small but frequent profits from sudden price movements. This means that they need to identify entry and exit points very quickly and often only stay in the trade for a few seconds or minutes before exiting.
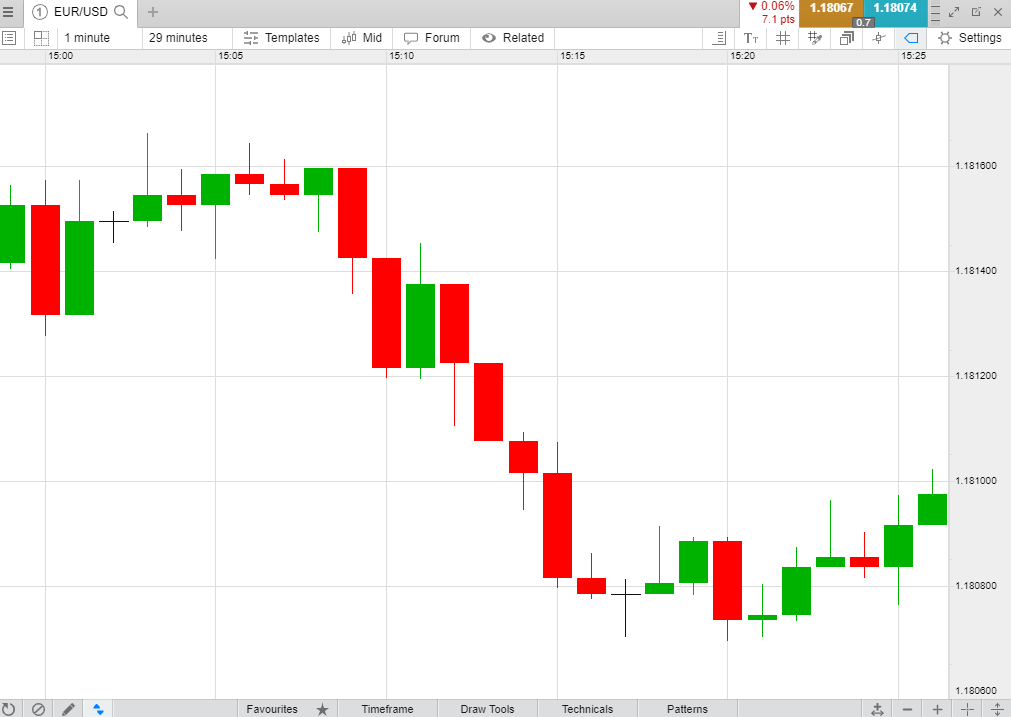
The below chart shows the currency pair EUR/USD, which is commonly used for forex scalping, given that the forex market is highly liquid. Each candlestick represents a one-minute interval between prices. As you can interpret from the chart, the price has only moved approximately eight pips (percentages in point) over a time period of 15 minutes, meaning that the currency pair is relatively stable and there are no large price fluctuations.
30-minute chart trading strategy
A 30-minute time frame chart is another short-term price chart that can identify sudden changes in trends and possible reversals or breakouts around levels of support and resistance. This is often due to a rush in supply and demand or speculation around an asset’s value or performance.
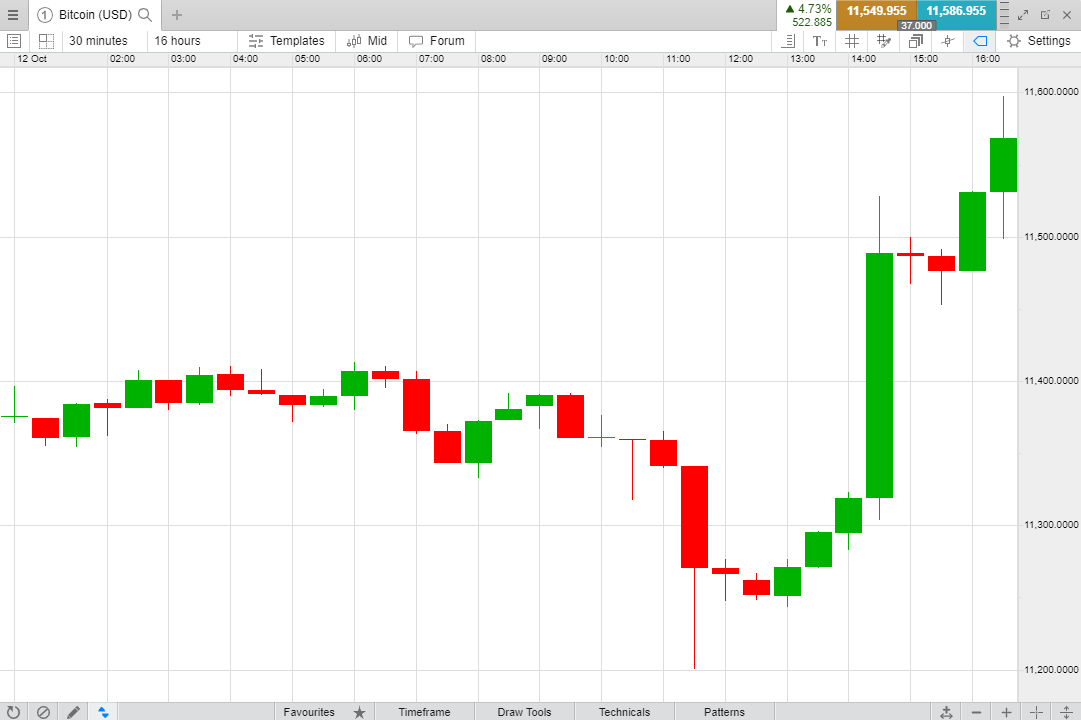
The below chart shows the price of the cryptocurrency, bitcoin, plotted on a candlestick chart in 30-minute intervals. As you can interpret from the graph, bitcoin’s price was steady for most of the day, until there was some volatile action between 14:00 and 15:00. This raised the price by approximately $200. Please note that bitcoin is only available to trade with a Pro account.
How to trade a 1-hour chart
In most cases, traders may say that a one-hour chart may be optimal for intraday trading strategies. This is because they can be used to confirm daily chart signals when used in conjunction with four-hour charts, to give a sense of direction of the overall trend. Day trading with a lower timeframe, such as 1-minute or 30-minute charts, can be confusing for the trader to keep up with, as they are usually looking to remain in the trade until the end of the day when they exit.
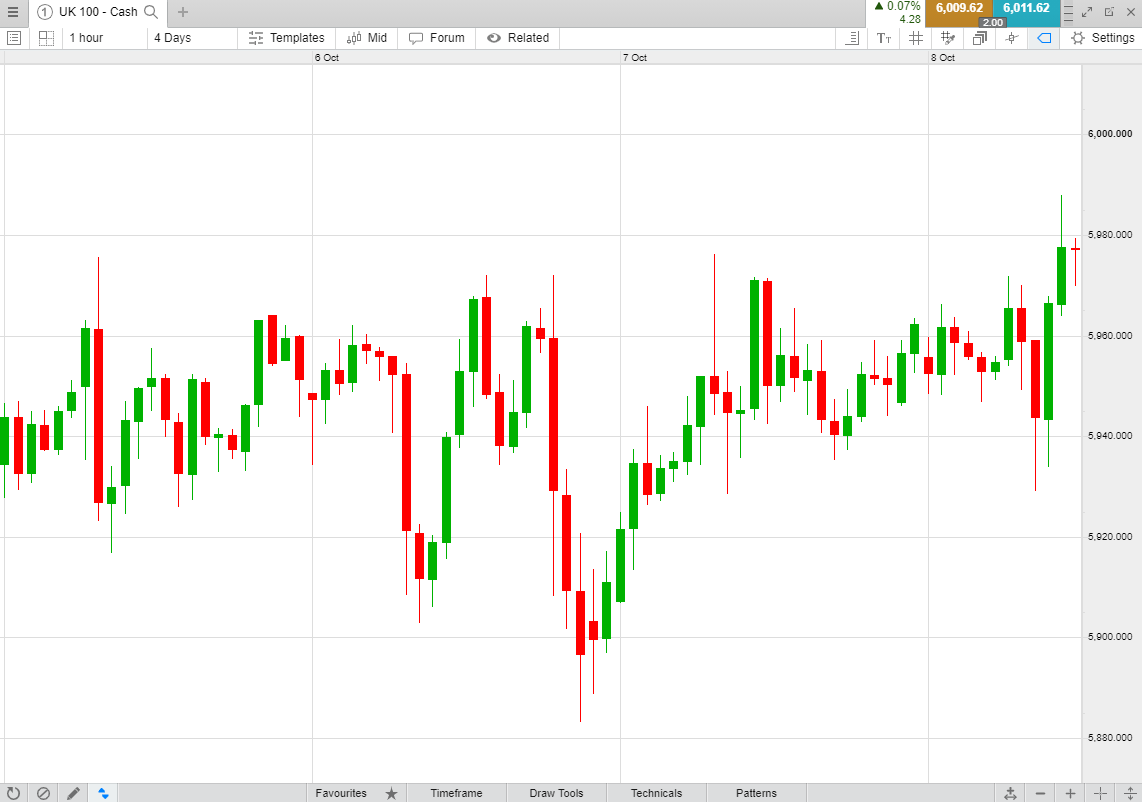
The below price chart is based on the UK’s largest stock index, the FTSE 100. Indices are commonly traded intraday, as their performance is relatively steady but can offer small fluctuations, depending on the constituent stocks that make up the index. Each candlestick represents a one-hour interval over a 4-day period. As you can interpret from the chart, there are some rapid price fluctuations, but overall, the FTSE’s price only increases by approximately £50 throughout the time 4-day time period recorded.
How to trade daily charts
Daily charts can be difficult to trade, as they require patience from the trader to study, there are fewer trading opportunities and there will often be gapping and slippage within the price charts, making trends less easy to spot. However, daily intervals are often used in a swing trading time frame. Swing trading is a strategy that aims to capture swing lows and highs in price action for an asset based on the wider assessment of the market. This means that traders are not constantly required to monitor price charts and make quick reactions to fluctuations, which can work well in the long term and this also comes with less risk.
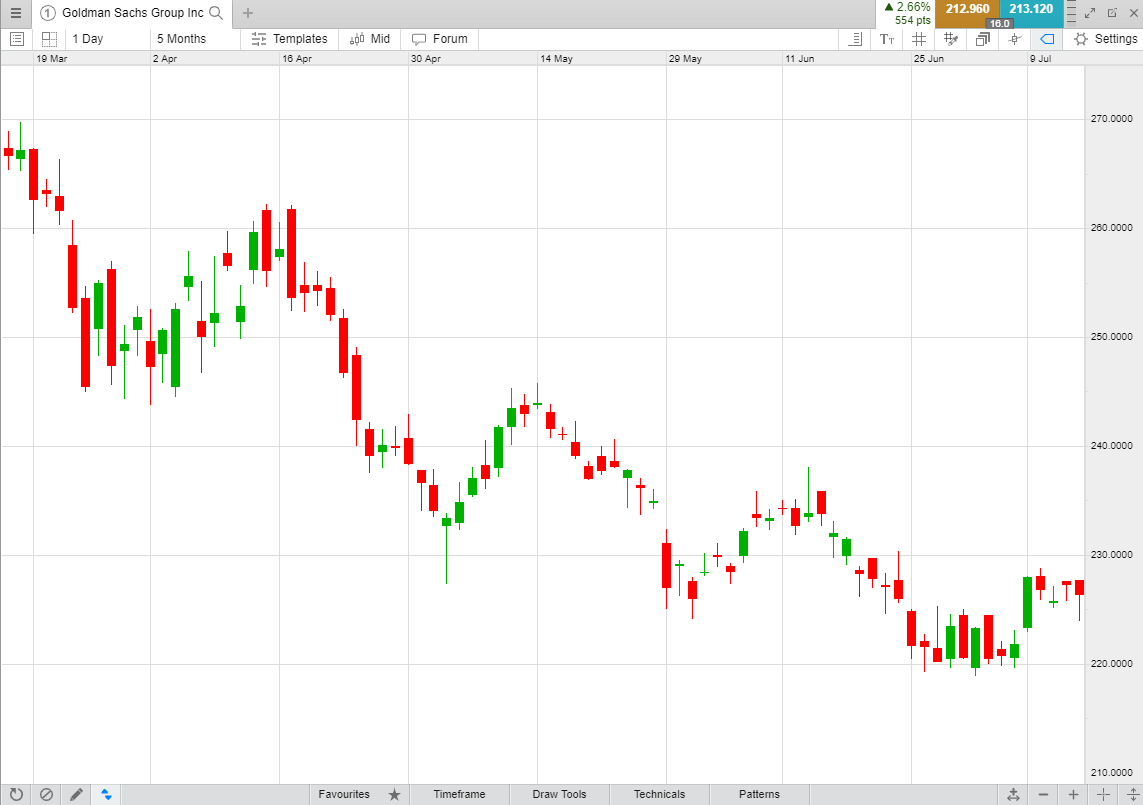
The below price chart shows the US-based stock Goldman Sachs over a period of five months. As you can interpret from the chart, there are several ‘swing lows’ in price action that a trader could use to enter the trade at an opportune moment. For example, swing traders tend to buy low and sell high on an uptrend in order to capture this swing in price. Each candlestick represents a one-day interval, and where the share’s opening price is higher or lower than the previous days close, you can see gapping on the price chart. Learn more about how to use daily charts for swing trading stocks with examples.
Ready to start spread betting and CFD trading on different timeframes?
- Practise risk-free with virtual funds on a demo account.
- Open a live account now. This gives you access to exclusive features such as our trading forum and live market data, where traders can share information and ideas with each other about the best chart types and time frames for a particular asset.
Seamlessly open and close trades, track your progress and set up alerts
Using multiple time frames in one chart
‘Multiple time frame analysis’ refers to using more than one chart time frame when carrying out a single trade. Some traders tend to focus on one specific timeframe, but this can result in ignoring the overall primary trend. Some traders may focus on short-term charts that give false buy and sell signals and indications of a new trend reversal or a breakout, which can also result in unsuccessful trades.
Therefore, some traders may wish to combine short-term charts, such as a one-minute or five-minute time frame, with the larger picture of the trend, such as a daily or weekly chart. This allows you to measure trendline strength based on recent and past data. For example, a day trader could focus on hourly charts for the overall trend direction of the asset, while also using 15-minute charts to identify more refined entry and exit points.
Multiple time frame trading system
Our award-winning platform comes with a variety of chart time frames, including the above examples that could be particularly useful for short-term trading. For longer-term trading, you can access 1-week and 1-month time frames, as well as historical price data. This price data can be up to 20 years, depending on how long the asset has been available for trading on our platform.
Familiarise yourself with our multiple time frame trading system by registering below for a demo account. This gives you access to our online trading platform, Next Generation, and our wide range of charting features, which includes price projection tools, technical indicators and various chart types.
To access live market data, our client sentiment tool and stock reports from Reuters and Morningstar, as well as our exclusive chart forum for social and copy trading, you will need to register for a live account.
FAQ
What time frame can day traders use?
Day traders can focus on hourly charts for overall trend direction and also shorter-term charts, such as 15-minute or 30-minute time frames, for more refined buy and sell signals. Learn more about day trading.
Which time chart is best for forex?
When trading forex, there is no definitive ‘best’ chart timeframe to use, as this can vary based on your trading strategy, whether it be short, medium or long-term. You can also use an analysis of all three, as long as the trading signals are visible. Read about our demo forex account to get started.
Which time frame is best for trading?
When trading the financial markets, the ‘best’ timeframe to display chart data depends on the asset that you are trading, the volatility of the market and your personal trading strategy. Browse our range of chart types and timeframes.
What timeframes are available to use in candlestick trading?
Candlestick trading is one of the most commonly used chart types among professional traders and these come with multiple time frame options. Candlestick patterns form easily over both short-term and long-term charts. Learn more about candlestick charts.
Which time frame is best for scalping?
Scalpers often tend to focus on short-term timeframes, as trades can often last between a few seconds to a few minutes, at most. Therefore, a one-minute or five-minute interval chart would display price data appropriately. Read more about scalping in forex.
