Having a strategy template can be a very useful part of the trading process, regardless of a trader's experience level. First of all, it can serve as a quick sanity check before placing a trade – a way for the trader to make sure that the opportunity fits in with their approach to the markets. Also, once the trade is closed, it can be constructive to review how it performed versus expectations. This can help to identify if there were mistakes made or are areas for improvement.
Creating a trading plan
A trading strategy template is a set of defined rules and steps that a trader can follow for every trade that they place. Having a defined trading strategy in place and a template to follow for each trade can help to maintain consistency and ensure disciplined, organised trading. It also helps to take the emotion out of trading, so traders stay calm and relaxed and don't make unplanned decisions.
The familiar management speak cliché "if you fail to plan, then you plan to fail" may sound corny, but there is definitely some validity in this when it comes to the world of trading. Individuals who don't have a template for their trading strategy and prefer to just 'shoot from the hip' when it comes to making their buy or sell decisions may well have fun, but it's probably not going to be a profitable exercise for them.
Why use a trading plan template?
How to set up a trading plan
How to set up a trading plan A trading plan doesn't have to be complicated; in fact, the best trading plans often have some very simple principles at their core. A simple strategy can still be an effective way of catching significant moves, meaning you can use it across a variety of different markets.
A basic template may start with a few lines describing the overall trading strategy, followed by a checklist for each trade as to whether or not it meets the criteria.
Trading plan essentials
Technical analysis
At the core of many strategies is the idea of trading with the trend, the often referred to trend-following technique, which is a part of technical analysis. Markets normally take a while to get to wherever they are going and trends can develop over hours, days, weeks or months.
The core to any trend-following approach is to first identify which way the trend is going, and use an opportunity of a slight change in this main trend to jump on board. For instance, if the market is in an uptrend, then a trader would be looking to buy, and if it’s in a downtrend, then the trader would be looking to profit from a fall by selling short.
Trendline analysis
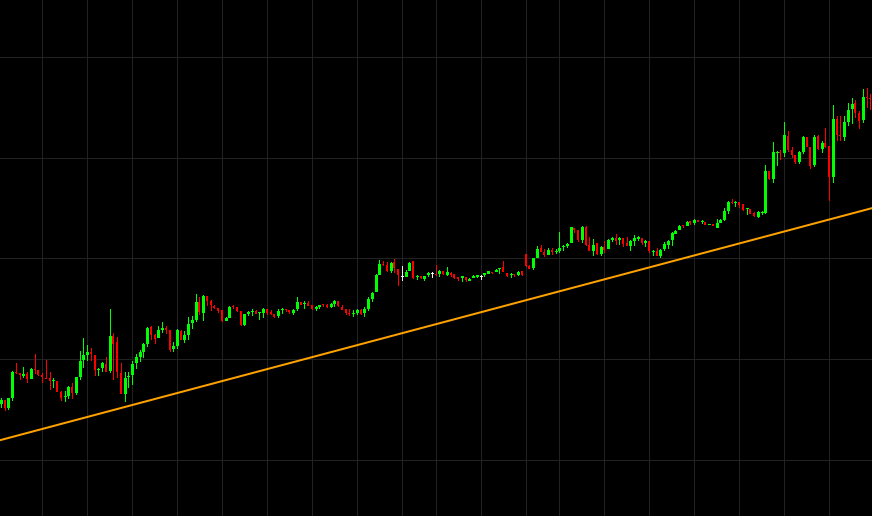
Trendlines are a simple but effective way of identifying trends to build a trading strategy. These sit below the lows in an uptrend, and above the highs in a downtrend. The below examples will illustrate the textbook approach of drawing these on a chart.

A trendline (uptrend) set through the lows

A trendline (downtrend) set through the highs
If we think that success in trading is down to playing the probabilities, then trading with the trend as part of a simple strategy would put us on the right side of market sentiment – momentum should be in our favour. Trends of course do not last forever and the trader needs to be ready to change opinion when the market does, but trend-following for most people can be a more effective strategy than trying to blindly pick tops and bottoms.
Support and resistance
As can be seen from the trend lines drawn on the two charts above, support and resistance act almost as a barrier to the price. A market that is trending upwards will have the occasional sell-off – markets do not move in straight lines, and this ebb and flow is all part of the trend. The trend-following trader will use weakness in an uptrend as an opportunity to buy in, using that trend line as a reference point. In an uptrend, while the market is above the trend line the trend is thought to still be intact and this can be a core component of an effective but simple trading strategy.
The opposite applies in a downtrend. In the GBP/USD chart above, the market does have the occasional strong rally but it fails to break through that falling trend line. These short bursts of strength would be used by trend-following traders to short sell and potentially profit from the next move lower. Only if the trend line gets broken by the price does it start to suggest that the trend you are following is running out of steam.
Trading market rises and falls
Spotting trends is easy on hindsight, but unless we have a time machine, we all have to trade in the present. There is a very good saying from a veteran trader that the trend really should jump out at you if it is there – you shouldn’t have to squint at the chart to try and spot it.The classic definition of an uptrend is higher highs and higher lows, while a downtrend is a steady procession of lower lows and lower highs. These should be easy to spot in your chosen timeframe. Adding the trend line will give you a reference point for where to enter a trade and, just as importantly, where to come out if the trend ends.
Realistic trading goals
Setting precise trading goals can help to enhance one's profit potential when trading the financial markets. In this article, we highlight the importance of setting trading goals as part of your strategy and show how you could achieve these when placing your trades.
It’s important to set goals in our personal and business lives, and the financial markets are no different. Goals offer direction, something to aim for when trading the markets and give a sense of achievement each time a target is hit. What sort of trading goals should you set?
Goal #1: risk control
A lot of traders end up losing too much in the beginning on trades that did not work out as planned. One way to mitigate risk and set a sturdy risk control goal could be to set aside a percentage of your account balance, 2% for instance, on any one trading idea. This would help to reinforce the approach of playing a good defensive game in the markets – critical to longer term success. This also means you can pat yourself on the back for sticking to your risk goal even when your trades do not turn a profit.
Goal #2: effort to reward ratio
Another goal could be to ask how much work you are prepared to put in to analysing the markets and finding good trades. For example, watching individual shares that make up the US S&P 500 index. One goal could be to review the charts for each share every month. So 20 trading days in a typical month would give a goal of looking at 25 charts a day at least, in order to hit the monthly goal.
You may only watch a handful of markets – such as the major forex pairs – but you could set yourself a goal of reviewing these markets for half an hour every Monday, Wednesday and Friday to keep you abreast of any opportunities. Doing one's basic groundwork when trading is important, and any time spent scanning the markets can be part of a defined trading goals strategy.
Goal #3: reviewing how the trades turned out
All traders find it useful to spend some time reviewing how their trades turned out. Even experienced traders will agree that learning about the markets never finishes. Setting time to look back on why you made certain trading decisions over the past month, how the trades turned out and what you could have done better can be invaluable in evolving a strategy that suits your individual trading personality. Committing to spend a couple of hours every month to go over old trades really will be time well spent and could deliver real returns for future trades.
Goal #4: setting profit goals
It is important to set realistic profit targets. Remember that even successful hedge funds and fund managers struggle to make more than, say, a couple of per cent a month on a consistent basis. If you are realistic about the sort of returns you are expecting, you won’t end up putting too much pressure on yourself for every single trade, and this should help reduce the stress of trading and have a corresponding impact on your results.
Summary of trading goals
All in all, having a disciplined trading process, adapting to changes in the market and identifying mistakes you feel you have made in the past are all steps towards your goal of seeing regular profits. See our article on trading tips and mistakes to avoid.

Seamlessly open and close trades, track your progress and set up alerts
Trading plan outline
Let’s take a look at a sample trading template for someone who is using a simple trend-following approach, based on buying into short-term weakness, or selling into short-term strength within an overall bigger trend. In this example, we’ll focus on the FTSE 100 index (CMC Markets’ equivalent instrument is called the ‘UK 100’).
The first part of the template, assuming it will be used to both plan the trade and review performance, will simply be the date and the market.
| Date | Market |
|---|---|
| 2 May 2019 | FTSE 100 |
Next should be the rationale for wanting to place a trade. Let’s say the major trend for the FTSE 100 has been up for the last week, but it has sold off so far today. This fits with the approach of buying a dip in an uptrend.
| Date | Market | Reason |
|---|---|---|
| 2 May 2019 | FTSE 100 | Trend by, buy pullback |
Next, enter the levels. Where will we buy, get out if it goes wrong (stop-loss) and just how far do we think this trade could go (target)?
| Date | Market | Reason | Entry | Stop | Target |
|---|---|---|---|---|---|
| 2 May 2019 | FTSE 100 | Trend up, buy pullback | 6,950 | 6,900 | 7,200 |
Next – and this is an important one – think about the size of the position. The strategy may be to only risk losing £100 on any trading idea. So, to calculate the size for this trade, the trader will need to know how far away their stop-loss is from their entry point. Once this has been calculated they will easily know how much to invest in this particular opportunity. If spread betting, a stake of £2 a point would allow them to put their stop-loss 50 points away from their entry point, giving them the acceptable £100 risk.
| Date | Market | Reason | Entry | Stop | Target | Stop distance | Size |
|---|---|---|---|---|---|---|---|
| 2 May 2019 | FTSE 100 | Trend up, buy pullback | 6,950 | 6,900 | 7,200 | 50 | £2 |
The example above illustrates that a trading template really can be very straightforward. It's easy to get caught up in the excitement of trading, with prices changing rapidly and charts flipping up and down, but impulsive trading is seldom a long-term successful approach. Using a simple strategy template such as this gives traders a framework to check against before placing a trade.
Track trading performance
Many traders will use a similar template to log the performance of their trades. In fact, it's easy enough to add more columns to the table above to record where the trade was closed, what the profit or loss was and what could have been done differently.
After using a strategy template before opening a position for a while, it really will become second nature. The business of trading is an ongoing learning process and recording the reasons for trades in this way, whether manually on paper, or using one of the many free spreadsheets available, is all part of taking a disciplined and professional approach to your own financial trading. See an overview of other trading strategies in our article on the most popular trading strategies.

