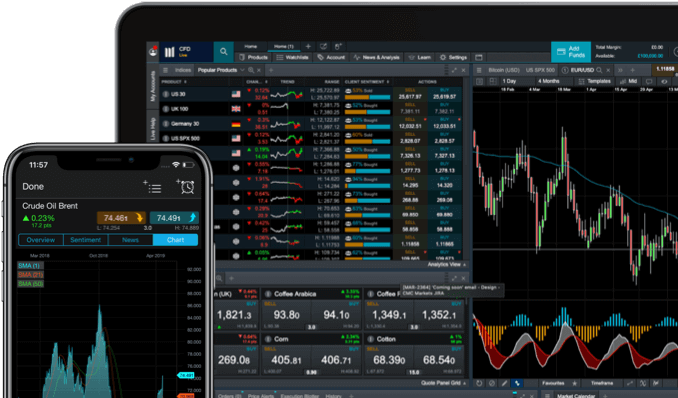
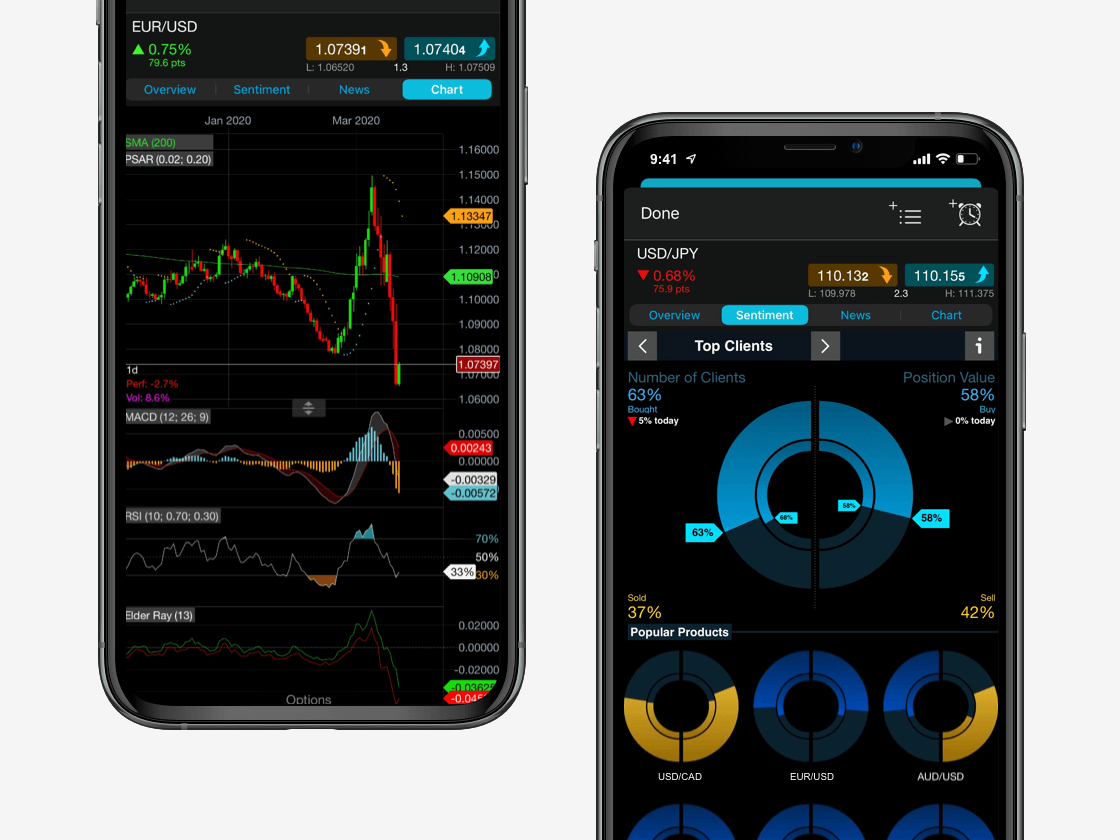
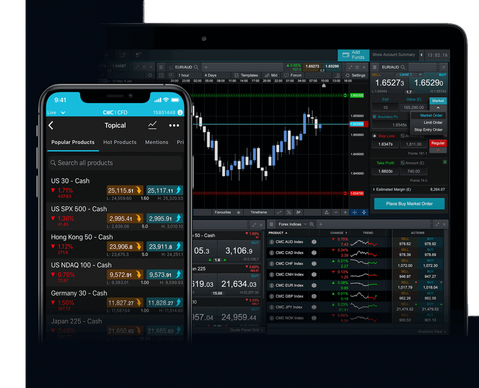
Today, candlestick charts are used to track trading prices in all financial markets. These markets include forex, commodities, indices, treasuries and the stock market. Stocks represent the largest number of traded financial instruments. The prices at which these instruments are traded are recorded and displayed graphically by candlestick charts. Candlestick charts are one of the most prevalent methods of price representation.
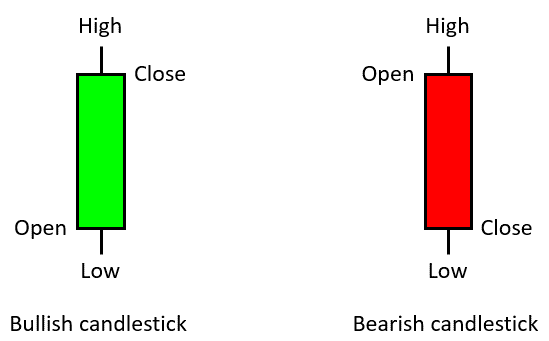
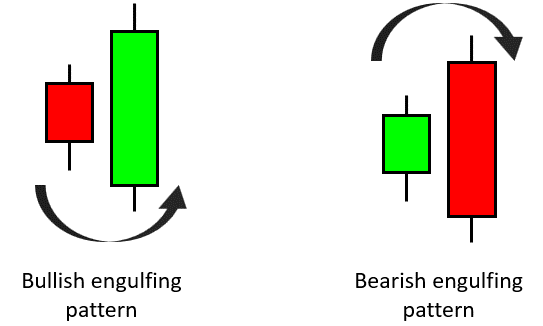
Candlestick chart analysis is an essential skill for traders. Candlestick charts are used to plot prices of financial instruments through technical analysis. The chart analysis can be interpreted by individual candles and their patterns. Bullish candlestick patterns may be used to initiate long trades, whereas bearish candlestick patterns may be used to initiate short trades.
