Indices trading: how to trade on indices
Indices trading is a popular strategy for many traders and investors who are looking to gain exposure to an entire market, investment theme or sector. In this guide, we highlight the most popular stock indices across the world and explain how you can spread bet or trade CFDs on derivative instruments that are based on major indices such as the FTSE 100 and more.
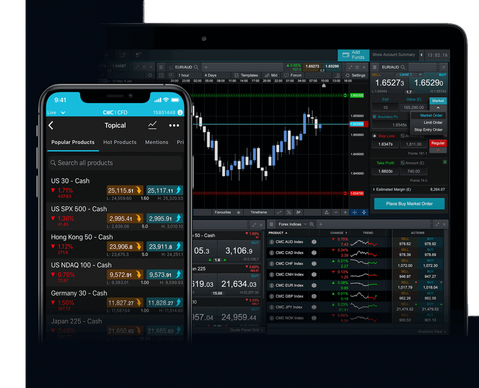
See inside our platform
Get tight spreads, no hidden fees and access to 12,000 instruments.
Start trading
Includes free demo account

What are indices and how do they work?
Indices are baskets of assets that show how different parts of the financial universe are performing. There are indices that track stocks, forex, bonds, and commodities. Each index is composed of assets and the index reflects the fluctuating values of the constituents within it.
Typically, when people refer to indices trading, they are talking about gaining exposure to global stock markets such as the FTSE 100, S&P 500 and Nasdaq 100. Some indices are categorised by the size of the companies they represent, such as the S&P Small Cap 600 and S&P Composite 1500. This helps provide investors with many trading opportunities. Businesses within an index must meet specific criteria. Companies within the S&P 500, for example, must have a certain market capitalisation.
Indices can provide a quick way to assess the health of a particular area of the economy and gain investment exposure to it. Stock indices, for example, can be quite specific, only holding assets from a certain stock market sector, industry or particular country. The movement of the index — up, down, or flat — shows how that area is performing, as a whole.
How are indices calculated or weighted?
Indices are calculated and weighted in different ways. The company that manages the index determines how the index is calculated and the weighting of the stocks within the index. Here are some common methods used:
- Equal-weighted indices are constructed by putting the same amount of capital into each stock, so they have equal weight within the portfolio.
- Market capitalisation-weighted indices are made up of a set number of companies that have the highest market value.
- Price-weighted indices give the most weight to stocks that are priced the highest. Stocks that are priced the lowest will have the smallest effect on the index.
Indices can be re-balanced periodically, such as daily, weekly, monthly, or quarterly, to ensure that the weighting of each stock is in line with the index’s formula and objective.
How are indices valued?
The value of an index depends upon many factors such as company productivity, prices, and employment. In order for a company to be added to an index, it could be selected by a committee, as is the case with the S&P 500. The committee will consider the eligibility of each new addition based on strict criteria, such as market capitalisation, financial viability, and length of time it has been publicly traded on the stock exchange. Otherwise, there will be rule-based entry, as exists with the Russell 1000 index, which consists of small companies.
Global stock indices as a performance benchmark
As an indicator or benchmark of the top-performing businesses in a particular industry, the value of an index is affected by the performance of its constituent companies. Benchmarking can be used to measure a fund or stock’s performance. Market indices will typically be used as a benchmark, as they can give a broad market view for comparison. Indices can help to track a market’s changes over time. An investor might use the FTSE 100 as a benchmark to assess their own portfolio’s performance, for instance.
Why trade on indices?
Indices can be a low-cost way to trade on a basket of stocks. Indices can have large daily price moves, since they have multiple assets contributing to their value and are influenced by several macroeconomic factors, which we will discuss in more detail below.
One benefit of trading indices is that they might pose a lower risk than individual stocks. As the risk is spread out across a number of assets, an index is unlikely to go to zero or go bankrupt, like an individual stock could.
Indices are often useful for longer-term investors that aim to diversify their portfolio, since a wide range of stocks or other assets can be purchased with a single transaction. They are also popular for day trading, since indices are often discussed regularly in the news and have price movements throughout the day that day traders attempt to capitalise on.
When an index is rising, it is said to be in a bull market. During such times, opening a long (buy) position on the index allows traders to potentially profit from the rise without having to buy, trade or research individual stocks. Similarly, when an index falls 20% or more, it’s said to be in a bear market and traders can potentially attempt to profit by shorting in a downward trending market.
Trade on our index-based instruments
What are the major stock indices of the world?
Here’s a list of the most traded global stock indices and their main constituents:
- S&P 500 is an index that includes 500 of the largest US companies by market cap, including Apple, Microsoft, and Amazon.
- Dow Jones Industrial Average (or Dow 30) includes 30 blue-chip US companies, such as American Express, 3M, and Walmart.
- NASDAQ 100 tracks 100 of the largest US technology stocks, with major holdings including Advanced Micro Devices, Adobe, and Alphabet.
- FTSE 100 tracks 100 of the UK’s biggest companies, including AstraZeneca, Unilever, and Diageo.
- Russell 2000 tracks 2,000 US small-cap companies, including Plug Power, Penn Gaming, and GameStop.
- CAC 40 tracks 40 of the largest companies in France, including L’Oreal, Total, and Sanofi.
- Nikkei 225 tracks 225 of the largest companies in Japan, including Mitsubishi, Kobe Steel, and Nippon Yusen.
- DAX 30 features 30 of the largest German companies, such as Linde, SAP, and Siemens.
- Hang Seng is composed of the largest stocks in Hong Kong, including Industrial and Commercial Bank of China, Xiaomi Corporation, and CNOOC Limited.
- EURO STOXX 50/600 is composed of the largest companies in the Eurozone, including ASML, Linde, and Sanofi.
- MSCI World is an index that holds stocks from multiple countries around the world, with its largest holdings tending to be US stocks.
- The CBOE Volatility or VIX calculates the 30-day expected volatility in the US stock market.
- NIFTY 50 represents the 50 largest stocks in India, including Reliance Industries, Tata Consultancy Services, and HDFC Bank.
- S&P/TSX 60 is the benchmark Canadian stock index, which features 60 stocks like Shopify, Royal Bank of Canada, and Toronto-Dominion Bank.
- KOSPI is the composite index of Korea, which tracks 900 stocks such as Samsung Electronics, Naver, and Hyundai Motor Company.
How to compare indices
Comparing indexes can be a useful exercise when deciding which sector you would like to invest in or trade. For example, The S&P 500 index is typically known for having lower volatility than the Dow Jones Industrial Average. So, for a long-term investor, the S&P 500 may be deemed more favourable.
The opposite is true for day traders who actively seek out market volatility in order to make potentially larger returns in shorter timeframes.
Indices can be compared by viewing price charts over equal timeframes, and the more data you have, the more accurate the comparison will be, as prices can change dramatically over a single day. For example, reviewing an index’s indices price over a period of one year will give you a more accurate impression of that market’s overall performance.
What are volatility indices?
Volatility refers to how fast prices change and is a way of gauging current market sentiment. The VIX volatility index was created in order to assess the S&P 500 market but is often used by investors and traders to study the volatility of the US market as a whole. The VIX volatility index represents the market’s expectations of price changes within the S&P 500 over the next 30 days.
A very high volatility often represents fear amongst investors, which is why the VIX volatility index is commonly known as the "fear index" or "fear gauge". When there is fear within the market, the VIX percentage value tends to increase in times of high volatility and decrease when the market stabilises.
Indices with a lower volatility, such as the S&P 500 Low Volatility Index, can be negatively affected by rising interest rates. This is due to the characteristics of sectors usually linked to these strategies, such as utilities and staples.
What factors move the price of global stock indices?
There are a wide range of factors that affect global stock indices. Here are some of the major factors:
- Politics and geopolitics can create stability and confidence, or instability and lack of confidence in the markets. When investors are confident, they tend to be more willing to buy stocks, which helps to push indices higher. When investors aren’t confident or don’t trust the stability of a political situation, they tend to save their money, which leads to stock prices to decline or be flat.
- Monetary policy is used to control the amount of money in circulation. When central banks increase the amount of money in circulation, more of that money finds its way into the stock market, which helps to elevate stock prices. When central banks decrease money supply, this has a dampening effect on stock indices since there are fewer dollars in the economy for buying stocks or for businesses to spend on the pursuit of growth.
- Fiscal policy, including tax cuts and spending, affects consumers, investors, and companies. Corporate tax cuts mean more profit for the company. That means better earnings and typically higher stock prices. The same concept applies to tax cuts for consumers, which gives people more money to invest in the stock market. Tax hikes tend to have the opposite effect by hurting corporate profits and leaving consumers with less cash.
- Economic performance and economic indicators can tell investors how the economy is doing. Data on inflation and employment shows whether there is likely to be more or less money flowing into stocks. A strong labour market is typically good for stocks, while increasing unemployment is not. Lower inflation is usually better for stocks, while higher inflation tends to dampen an index’s performance.
- Financial shocks and unforeseen negative events (sometimes referred to as black swan events) can lead to a stock market crash, such as unexpected incidents like a pandemic or a dramatic decline in another asset class that rattles investor confidence. It could be the failure of a major bank or corporation that affects many people and investors, or it could be a drastic change in tax law or government policy. Financial shocks happen quickly, and stock indices often fall initially as a result. Whether the stock indices continue dropping, or rebound, depends on the severity and likely duration of the bad news.
- Investor sentiment is how investors feel toward stocks. As a group, are investors more likely to buy or sell? This is what pushes prices up and down. Sentiment is determined by all the other factors mentioned above. When sentiment gets extremely high, or euphoric, that is potentially a sign of a stock market bubble.
- Constituent performance is what directly affects the performance of stock indices. The performance of the stocks within the index is what gives the index its value. If the vast majority of stocks inside are falling, the index should fall. Similarly, if the stocks inside are rising, the index should rise.
What are the best days to trade on indices?
There is no definite best day or time to trade on indices, but certain points in the day tend to have larger and more frequent price movements than others. For example, the market opening and the last hour before closure tend to show the greatest volatility. It is also stated that typically, both Mondays and Fridays see more volatility than Wednesdays.
However, greater volatility should be treated with caution. This is because as much as it is possible to attain larger profits, the potential to make larger losses also poses a threat, so this should be considered within your risk-management strategies.

Strategies for trading stock indices
Trading index internals
This is where traders look at the health of the stocks in the underlying index, which are called market internals. Market internals include market breadth indicators such as:
- The number of advancing stocks versus the number of declining stocks (also known as the A/D line).
- The number of stocks making new highs or new lows.
- The number of stocks above or below a 50 or 200 day moving average.
- The Arms Index [TRIN], which compares the AD ratio to AD volume.
- The TICK index, which measures the minimum upward or downward price movement.
These indicators either confirm what the index is doing, or they are diverging. When market internal direction diverges with the stock index direction, this forewarns of a potential reversal in the index.
Trading the news
News events such as the release of fresh economic data, which are scheduled in advance in an economic calendar, can cause volatile price movements in a stock index. For example, one of the economic indicators most likely to move the market is non-farm payrolls, which is a measure of employment in the US (one of the Federal Reserve’s main mandates) and is released on the last Friday of every month. One of the biggest market-moving news events is central bank interest rate announcements. These announcements often cause quick price moves, with follow-through movement that can last for days as traders digest and trade the news.
Trading on market sentiment (risk on/risk off)
Market sentiment is how willing people are to buy or sell. When sentiment is increasing, this is typically a good time to own stock indices, since more people are buying stocks. This is called “risk on” because people are willing to take on risk and buy. As bullish sentiment declines, or bearish sentiment increases, stock indices are more likely to decline. This is called “risk off” because people are selling assets to remove the risk of the position.
Trading market positioning
Market positionings shows the extent to which traders are long or short on an index or financial product. When positioning reaches an extreme, which will vary by each index, that may indicate a potential reversal in the price of the index. As an example, if 99% of index positions are long, that shows there are very few people who have shorted or think the market could correct lower. Such a scenario often ends with a price drop.
When trading on indices with our Next Generation platform, we use a client sentiment indicator that shows the percentage of clients that are long and the value of those trades, which can be used to inform your view on market positioning and take trades according to your strategy.
Trading intermarket correlations
Stocks and stock indices are affected, and can have an effect, on other assets. For example, a rising VIX index tends to correlate with falling stock indices. Rising bond prices tend to be good for stocks as it shows interest rates are getting lower, while falling bond prices means lack of demand to own bonds, higher interest rates, and downward pressure on stock indices.
Trading using technical analysis
Technical analysis uses statistics, technical indicators, and the price history of the stock index itself to help determine the future direction of the index. Popular technical indicators include the MACD, RSI, and Bollinger Bands. Traders can also use support and resistance, which are price levels that may form a temporary top or bottom in the trajectory of the index. They also utilize candlestick chart patterns to try and predict where the market will go. These tools are used to create technical analysis strategies.
Trading the trend
Indices may form trends intraday or over the longer-term. Trend trading involves buying as prices are rising, assuming the trader believes prices will continue rising. If the price is falling, in a downtrend, a trader may short if their analysis determines that prices may continue falling. Since indices move to different degrees, some traders may opt to use leverage trading to magnify the price movements of the index.
Trading the opening gap
Indices can gap higher or lower over the weekend, as there is no trading between Friday and Sunday (or Monday in some cases). A gap occurs when the opening price on Sunday is different than the closing price on Friday. In the event of a gap, some traders use a gap trading strategy where they watch for the price to move back toward the Friday close.
Trading with mutual funds
Trading on indices via a mutual fund is another popular way to invest. A portfolio is set up to match the performance of a particular index. Mutual fund managers provide index funds that track the FTSE 100, for example, which often offer broad market exposure.
If on average the share price of the index’s constituents goes up, the value of the index should rise along with them. If these companies’ share prices fall, the value of an index should drop. Since indices are made up of many stocks, their value tends to fluctuate. Some indices are more volatile than individual shares. This has the benefit of numerous trading opportunities but can also add risk for the trader.
How can I trade on indices?
With CMC Markets, you don’t trade on or invest directly in the global index. Instead, through spread bets and CFDs, you can speculate on the price movements of derivative instruments that are based on the FTSE-100 and more. Traders can take a position based on whether they think its value will rise or fall, and subsequently make a profit or loss depending on which way the markets move.
Here’s a breakdown of how this can be done on our Next Generation platform:
- Open and fund a live trading account. By creating an account with us, you will have instant access to our free demo account, where you can practise trading risk-free with virtual money.
- Within the product library on the platform, select ‘Indices’.
- Choose an instrument to trade. We offer spread betting and CFDs on instruments that are based on the FTSE 100 and more major stock indices.
- Click on the index name to bring up a chart. Here, you can customise by chart type and timeframe, and add technical indicators and draw tools for technical analysis.
- Pick a strategy. Decide whether you want to go long (buy button) or go short (sell button).
- Input the order type, entry price, and how much you are willing to risk per point of movement (spread betting account) or position size (CFD account).
- Control risk on your trade. Many traders opt to use stop-loss orders to control losses as much as possible.
- Place the order and monitor.
Example of an indices trade
Assume a trader believes that UK stocks will fall, and they want to potentially profit from the decline by trading on our UK 100 – Cash instrument. Using a spread betting account, they open a position on our derivative instrument.
They determine how much they wish to risk per point of movement in the index. Assume they go short at 7,069, and they are willing to risk £1 per point. Assume they believe that if the price falls, it will fall to 6,800. This is where they place the profit target, 269 points below the entry. If the price falls and reaches the target price, the trade is closed for a £269 profit.
They place a stop loss at 7,100, which is 31 points above their entry price. This means that they are risking £31 on the trade. If the price moves up to 7,100, they could exit the trade at a loss.

[Diagram is for illustration purposes only. Past performance is not indicative of future results.]
Cash indices vs forward indices
We offer both cash and forward assets on our Next Generation trading platform. Whereas index forward contracts have an expiry date, a cash index does not, but you can automatically roll your position over into the next contract on expiry. With a cash index, you pay an overnight holding cost but with forward trading, you do not. This makes forwards cheaper to trade than cash indices if you are holding over a longer period. Cash prices and forward prices will often be slightly different since a forward doesn’t mature/expire until sometime in the future.
Type an index name into the platform’s search bar and you can find the option to trade a cash index and/or forward indices. Forwards have a future date next to the index name.
What are the major index trading hours?
Trading hours vary by the index. For exact trading hours on each index, right click on any index name in the product library and select ‘Product Overview’.
For example, our trading hours, in London time, for the US SPX 500 forwards are from 07:00 to 22:00, and then again from 23:00 to 07:00. There is no trading between 22:00 and 23:00. Trading ends at 22:00 on Friday and resumes at 23:00 on Sunday.
Trading hours on the UK 100 (London time) are the same as the SPX 500, except that trading begins at 23:05 (instead of 23:00) on Sunday.
Risks of indices trading
Indices trading is considered by many to be a lower-risk strategy, as you are spreading your risk across an entire segment or sector, as opposed to a single stock. However, there are still some risks involved.
You are trading a derivative instead of a physical asset. Here, a derivative is an instrument that obtains its value from the price of an underlying asset, such as an individual stock or stock index. The risk is that the movement of just one stock or security within the index could have a major impact on the value of the index.
It’s therefore important to do some research prior to trading indices. It’s a good idea to make use of risk-management tools to protect your positions against sudden market moves. These include stop-loss orders such as guaranteed stop-losses. A stop-loss order will close a losing trade once price passes a trigger value pre-decided by the investor. These are very effective in the event of sharp price action.

Practise trading with virtual funds
Seamlessly open and close trades, track your progress and set up alerts
FAQ
Indices vs indexes: what’s the difference?
The difference is only grammatical. They are the same thing for trading purposes.
What are some global index ETFs?
Some global exchange-traded funds (ETFs) that track the performance of major stock indices include Vanguard FTSE All-World ex-US ETF, Vanguard FTSE Emerging Markets Index ETF and Vanguard FTSE Developed Markets ETF, all of which can be traded on our Next Generation platform.
Can you make money trading on indices?
It is possible to make money when trading on indices if the markets move in your favour. Profit potential depends on if the strategy being used is properly executed. Read our guide on how to develop a trading edge for guidance.
What are the costs related to trading on indices?
With a spread betting account, traders can trade tax-free on indices*, where you just have to pay the spread but no commissions (other fees and charges may apply). You could also use forward contracts to avoid overnight holdings costs. See the spreads of our main indices.
What happens when indices rebalance?
When indices rebalance, there is negligible impact on the index since it always reflects the value of the constituents at any given time. But when a new stock is dropped or added to an index, the price of that company can sometimes see a substantial movement in price, so it may be a good idea to keep an eye out for constituent changes.
How can I trade on forex indices?
A forex index tracks a basket of currency pairs that share the same base currency, giving you exposure to a particular currency’s movement. Learn more about forex indices we offer, from GBP, USD, JPY & CHF all the way to CNH & SGD.
Disclaimer: CMC Markets is an execution-only service provider. The material (whether or not it states any opinions) is for general information purposes only, and does not take into account your personal circumstances or objectives. Nothing in this material is (or should be considered to be) financial, investment or other advice on which reliance should be placed. No opinion given in the material constitutes a recommendation by CMC Markets or the author that any particular investment, security, transaction or investment strategy is suitable for any specific person. The material has not been prepared in accordance with legal requirements designed to promote the independence of investment research. Although we are not specifically prevented from dealing before providing this material, we do not seek to take advantage of the material prior to its dissemination.
See why serious traders choose CMC
Get tight spreads, no hidden fees, access to 12,000 instruments and more.
FCA regulated
Segregated funds
Learn more
Includes free demo account