A stock market breakout or a breakout in a specific share is a tradable event that some active investors can base an entire strategy around. A breakout is when a stock or stock index moves beyond a level of support and resistance that it has struggled to move above or below in the past. Learning how to identify and trade potential breakout stocks gives traders one more tool that they can use to generate profits within an often-volatile market. Breakout stocks are shown on price charts, in particular, using candlestick charts to read price action.
How to identify breakout stocks
When a stock in the share market is about to make a big move, investors want to be the first to know. This article explains how traders can identify when a stock is potentially about to breakout, using trading charts and examples, and how breakout strategies can be incorporated into a wider trading strategy for the share market.
What is a breakout in the stock market?
Stock breakout patterns
Price action within the share market is affected by supply and demand, and when a breakout signal occurs, this usually means that buyers have succeeded in pushing the stock’s price above the resistance level. In the case of a downside or negative breakout stock, sellers have pushed the price below support. While not all breakouts lead to big price movements, every big price movement will have multiple breakouts, typically starting with an initial breakout.
There are certain patterns that traders should recognise for their investment research if they wish to catch these potential stock breakouts early in the process. Below are some of examples of how to identify breakout stocks.
Seamlessly open and close trades, track your progress and set up alerts
Cup and handle breakout stocks
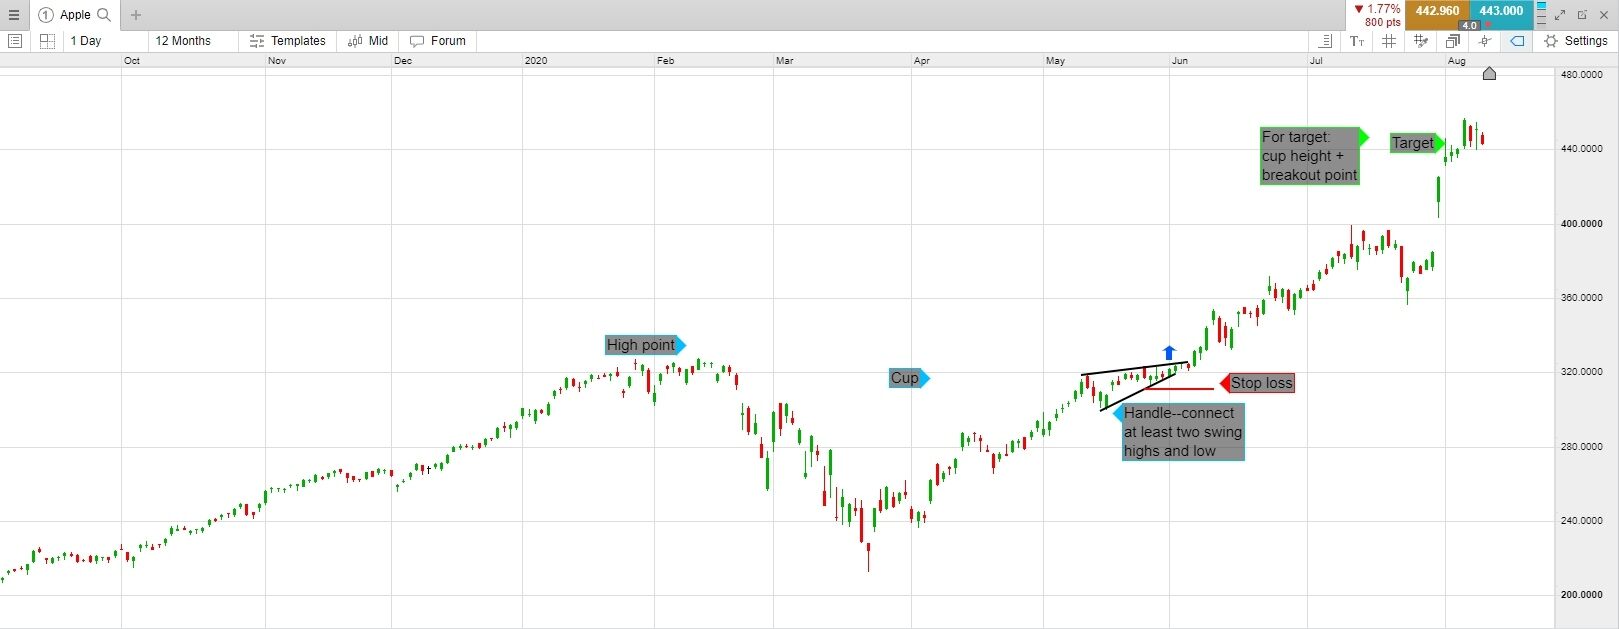
A cup and handle pattern is a common chart pattern formation for both individual stocks and stock indices. It occurs when the price falls from a high point but then gradually recovers to that level. It does not need to be an all-time high, it can be a 52-week high or any other high point that looks significant on the chart. This forms the cup.
Once the share price is near the prior high, if the price swings start to get smaller and smaller, this means that the size of the price movement is contracting. You can draw trendlines on the swing highs and lows of these price swings, in order to see the handle of the cup, using the drawing tools on our advanced online trading platform. When the price moves above the upper trendline of the cup, traders may consider buying.
A stop-loss can be placed placed below the handle, and you can estimate the target to get out at by taking the approximate height of the cup added to the handle breakout point. In the case of the Apple chart example below, the entry is near $325. From analysing the cup, we can see that it is approximately $110 in height. Added to the breakout point, this gives a target of $435.
Bollinger Band breakout stocks
You can also use Bollinger Bands, which are a technical indicator for trading strategies, to help identify breakout stocks. On a candlestick chart, Bollinger Bands move with the price, forming an envelope around it. The bands are placed a specified number of standard deviations away from the 20-period moving average, which can be adjusted. The price will often stay inside the bands.
Watch for the bands to visually narrow and move sideways. When the price is making large movements, the bands will be wide apart. When the price is moving steadily, the bands will contract. Quiet periods are often followed by larger price movements and a subsequent breakout. In the Alibaba stock chart below, we can see that Alibaba shares showed this pattern before doubling in price over the next year. Note how the bands narrow compared to their prior width. A breakout above the Bollinger Band signals a potential breakout.

A stop-loss order is generally placed at the lower Bollinger Band after entry. As the price increases, it is possible to move the stop loss up along with the lower Bollinger Band as well. With an entry near $105, this would have kept the trader in until $150, when the price touched the lower band.
Read more in-depth information about essential stock chart patterns here.
Breakout strategy for stocks
Trading a breakout stock is not quite as simple as buying or selling when a breakout to the upside or downside occurs. Making the entry is only one part of a robust strategy: you will also need a stop-loss, which controls the initial risk of the trade. A breakout strategy for stocks also requires an exit point if the trade turns profitable. Unlike long-term investors, breakout traders nail down their profits periodically.
Each of the breakout methods discussed below involve both a stop-loss and a way to take profit. A stop loss should be placed on every trade so that no single losing trade will erode your account substantially, whereas the profit target is more flexible. You can use a profit target or calculate the risk/reward ratio to see if the trade is worth it, or a trailing stop loss, like in the Bollinger Band example above.
Before placing a trade, you must know what your entry, stop loss, and exit methods are in order to increase your chances of making a profit over time. Read more about execution and order types here.
Breakout pullback strategy
So, what happens if you miss the initial breakout? Say a stock bumped up against a resistance level multiple times and then finally broke above it, but you did not spot it right away. Often, there will be a second chance to trade when the price falls back to re-test the breakout area. Assuming that the breakout had critical signals of an effective breakout, we can assume that that re-testing can be used to enter a trade.
In the below chart, the Euro 50 index tried three times to climb above the trendline resistance area. On the fourth attempt, it finally broke through. At first, it moved up only a small amount, then re-tested the breakout area. It then proceeded to re-test the breakout trendline two more times, rallying after each re-test.

Traders enter near the re-test area once the price starts moving back up, on whatever timeframe you are using. A stop-loss is usually placed three cents or ticks below the recent low that occurred just prior to entry. This strategy does not have a profit target, but some traders consider exiting once you have attained three times their risk or more. For example, if you buy at £3,600 and place a stop loss at £3,580, your risk is £20. If you exited with a profit of £60, or £3,660, this is a 3:1 risk to reward ratio, but you could also opt to use a different ratio instead.
Stock breakout signals
Once you identify breakout stocks, you need to look for a decisive movement, whether it be the candle or price bar where the breakout occurs that must move convincingly through the breakout area. If it moves just above and then the candle closes below the breakout point, this is not as effective as a stock that surged and closed the period well above the breakout point. A decisive breakout is more likely to follow through in the expected breakout direction.
Consider the Euro 50 index example, above. The price decisively broke above the trendline on a long candle that closed near the high of the period. Even though the index re-tested the breakout area, the former area held.
Another signal of a good breakout is if the breakout area holds on re-tests. If the price falls right back through the resistance level, this is not a good sign and traders could look to exit the trade. If there are no positive signals, a trend reversal in the opposite direction is more likely.
Breakout stocks with high volume
On a breakout, if you notice that volume has increased above average levels, this is a positive sign. It helps to affirm that the price trend is more likely to keep moving in the breakout direction. The bigger the increase, the better. A 50% increase over average is good, but 100%, or double the average volume, is even better.
If the price breaks out on lower-than-average volume, this means that few people are interested in buying the stock above the breakout point. This means the stock is less likely to hold above the breakout point and run higher.
How to spot penny stock breakouts
Penny stocks tend to have big percentage moves, even though they do not move much in the way of price. For example, a penny stock may trade between $0.04 and $0.05 for a long period of time. Although it is only an increase of a cent, this also represents a 25% leap in value.
Because penny stocks do not move as much in dollar terms, their support and resistance levels are often well defined and easy to spot. For example, Gold Standard Ventures is a penny stock in the mining industry. For almost a month, its share price could not move above $0.74. When it did finally break above this level, it did so in an aggressive manner. Traders interested in the stock could have placed a buy order at $0.75, just above the resistance level.

Shorting a downside breakout
The examples above look at buying a stock when it breaks out above a specified level. There are also potential trades when the price drops below a support level. This is called a downside breakout. The concepts for a short trade are the same as discussed prior, except everything is flipped upside down.
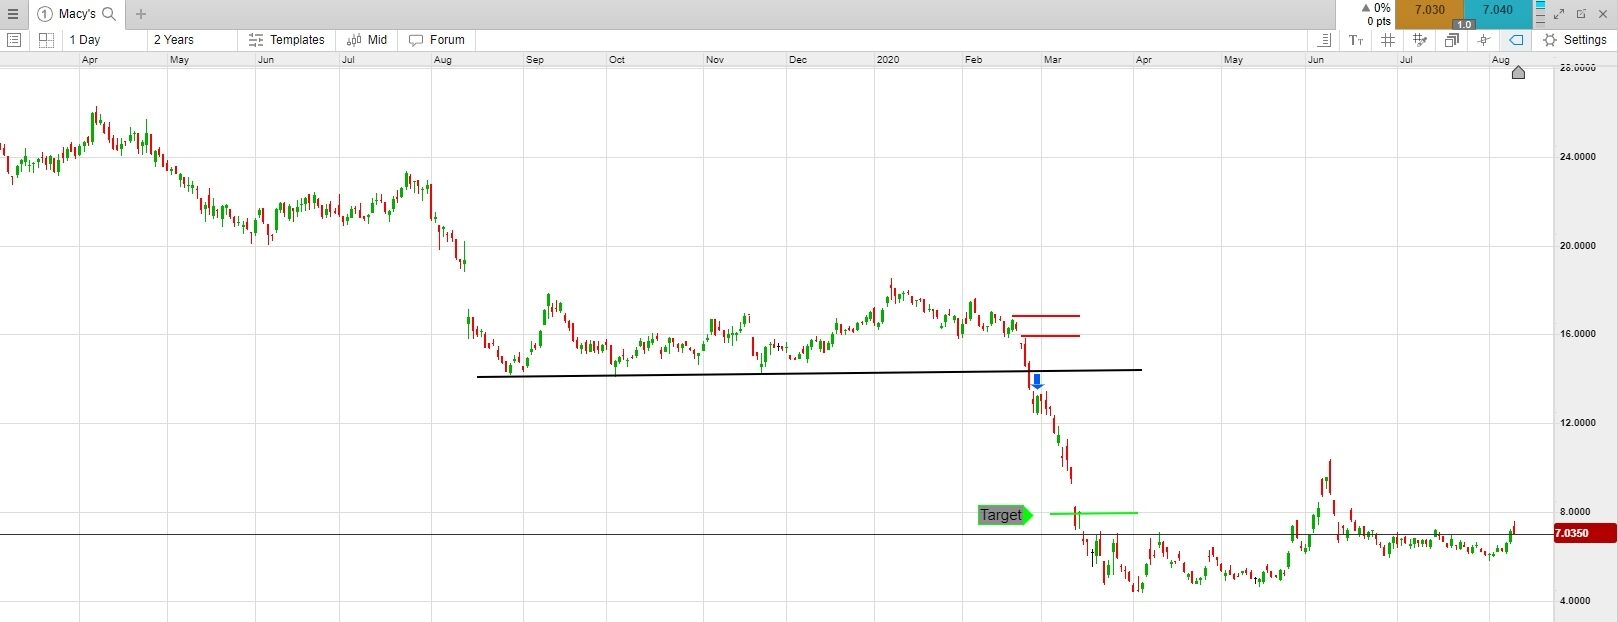
Consider Macy’s stock chart below. It had already been declining before it found support just above $14. It bounced off this level three times before finally plunging below. A short trade could be entered on the breakout. A stop-loss can go above a recent swing high, near $16.75, or near the gap lower prior to the breakout at $16. If shorting just above $14 and risking $2 per share, a target could be placed at $8. This is $6 below the entry point and provides a 3:1 risk/reward ratio.
Learn more about how to short a stock.
Trade on potential breakout stocks
Breakouts in the stock market can provide the opportunity to trade on large price movements once the price breaks above the resistance level or below the support level. Traders first look for potential breakout stocks, followed by a decisive breakout on a strong price movement that is accompanied by above average volume. Since these signals occur in both shares and share indices, and one index encompasses many stocks, it is likely that if an index is having a breakout, a lot of individual stocks within the index are as well.
Not all breakouts end in profit, as prices could always end up moving the other way, resulting in a loss. This is called a false breakout. Another result is that the price may breakout but then fail to move much afterwards. Not only does this mean that you will not get the profit expected, it also ties up your capital, wasting time and energy. For this reason, it is advisable to place a stop loss on each trade. This controls the risk and ensures that one losing trade does not jeopardise the whole account.
- Register for a live account to start spread betting and trading CFDs on potential breakout stocks on our Next Generation trading platform. As mentioned, you can take advantage of our drawing tools such as trendlines, technical indicators such as Bollinger Bands, and more customisable chart types. This helps to display your data clearly on price charts for optimal results.
- Alternatively, you can also trade the financial markets on our demo account with £10,000 worth of virtual funds. This allows you to practise your breakout strategy risk-free. Please note that shares and ETFs are only available on a live account.
Practising when to exit in order to nail down profits is also important, and it is best practice to combine more than one breakout strategy. Trades will not move favourably forever, and reversals occur regularly. A thorough strategy will allow you to take profits while they are still there. Learn how to trade volatile breakout stocks.

Seamlessly open and close trades, track your progress and set up alerts
