Spread bets and CFDs are complex instruments and come with a high risk of losing money rapidly due to leverage. 69% of retail investor accounts lose money when spread betting and/or trading CFDs with this provider. You should consider whether you understand how spread bets and CFDs work and whether you can afford to take the high risk of losing your money.

Relative strength index (RSI)

The relative strength index (RSI) is a popular momentum oscillator​​ that can be used to determine the future direction of a market. Traders can use the RSI to gauge whether momentum is accelerating or decelerating. It can also be used to evaluate whether a security is overbought or oversold. The RSI is a popular technical analysis tool and can help traders identify and generate trading opportunities in the markets.

Learn how the RSI is calculated and how this type of trading indicator​ can be used within the financial markets.

See inside our platform

Get tight spreads, no hidden fees and access to 12,000+ instruments.

RSI meaning

RSI stands for relative strength index. The RSI was developed by J Welles Wilder Jr as a momentum oscillator to measure the rate of change of price movements over a specific period. The default period used to calculate the RSI is 14 days, but weeks, months and intraday data can also be used. Traders interested in day trading and swing trading can consider shorter periods to calculate the RSI.

The RSI can be used in conjunction with other indicators. It provides important information that traders can use prior to entering a position.

RSI indicator

The RSI indicator generates a measurement between zero and 100. According to Wilder, the RSI is overbought when the index has a reading above 70, and it is oversold when it has a reading below 30. In addition to overbought and oversold levels, the RSI can also introduce signals by looking for divergence, failure swings and centreline crossovers.

The RSI can also be used to identify trends​​. Very overbought and very oversold periods are defined at 80 and 20 respectively. The rate of change of price action can indicate if momentum is accelerating or decelerating. This is important as it can help traders determine the current trading environment and define which strategy to adopt. For example, many traders buy on a dip when negative momentum is decelerating and sell on a rally when positive momentum is decelerating.

Alternatively, you may want to buy on a breakout when positive momentum is accelerating, and sell on a breakdown when negative momentum is accelerating. The RSI will provide enough information to determine if the price of an asset is experiencing negative or positive momentum and whether that momentum is accelerating or decelerating.
RSI formula

The RSI is an index between 0 and 100. It is calculated by the following formula:

100 RSI = 100 - (100/1 + average gain / average loss)

The bulk of the calculation is determining the average gain, divided by the average loss. This is referred to as relative strength or RS. The default that Wilder determined is a 14-day period. This can be changed and used on all measures of time. Additionally, losses are expressed as positive values.

RSI calculator

The index is easily calculated once the average gain and loss have been determined over a 14-day period. Since an average of the past 14-day period is needed, you would have to calculate the average gains and losses.

  1. The first calculation is the sum of gains over the past 14 days, divided by 14.
  2. Then you would calculate the sum of the loss over the past 14 days and divide this figure by 14.
  3. This generates the first average gain and first average loss.

Wilder's RS formula is then normalised to create an index between 0-100. This generates an oscillator that swings back and forth but cannot rise above 100. The normalisation makes it possible to easily identify the range of the RSI and overbought or oversold levels.

The RSI can reach zero when the average gain equals zero. If we assume a 14-day period, a RSI with zero value would mean that prices moved lower in all 14 periods. This means that there are no gains to measure and the RSI by default has a value of zero. The RSI, on the other hand, is 100 if all 14 periods experience gains. Since there are no losses to measure, the index by default becomes 100.

Use the relative strength index for thousands of assets

How to use the relative strength index

The RSI can be used in several ways to determine market trends. The most popular way of measuring market trends is to evaluate whether a security is overbought or oversold. This method employs a contrarian style of trading the market: one buys the dip because the proverbial rubber band has stretched too far too fast and is likely to bounce back.

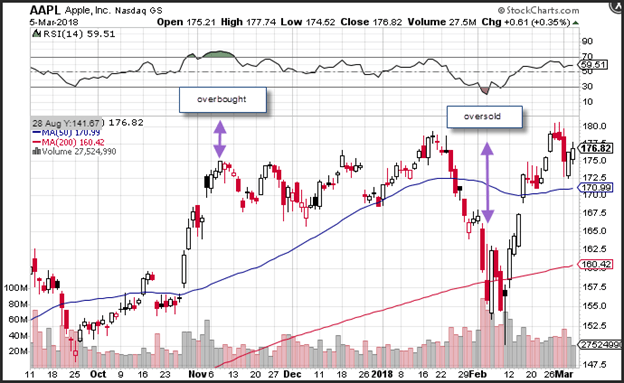
For illustrative purposes only. Apple share price 6-month chart from October 2017- March 2018. Source: StockCharts.com

  • The chart above shows the price of Apple shares along with the RSI in the upper panel for the six months ending 5 March 2018. Apple’s share price was overbought once in early November 2017, according to the RSI. Apple shares were oversold once in mid-February 2018. The RSI reached a high of 76 in November 2017 and a low of 17 in February 2018.
  • As with any technical analysis​ study, the RSI can be used in conjunction with other tools, including the 200-day moving average​. In the above chart, Apple shares consolidated around the 200-day moving average in February. There is generally no RSI formula that can be relied on to determine when the rebound will occur. This means that prices could remain below 20 for months before experiencing a rebound.
  • One could evaluate past overbought or oversold readings to see how long prices may remain overbought or oversold. These could also be used to determine how extreme the reading appears to have become. For example, Apple shares have been overbought six times in the past five years and oversold 13 times.
  • A rudimentary trading strategy would signal purchasing Apple shares when the RSI is in oversold territory and short selling Apple shares when the RSI is in overbought territory. One can enhance this strategy with the RSI or use another indicator such as a moving average. The RSI can be used across a range of asset classes, such as currency pairs, indices, commodities and shares. It can also be used across daily and forward contracts for spread bets and contracts for difference (CFDs).

RSI trading strategies

RSI crossover strategy

The crossover strategy is one way of using the RSI as an overbought indicator in conjunction with decelerating positive or negative momentum. One would purchase Apple shares after the RSI crosses above the 30-trigger level, following an oversold reading. A sell signal is generated when the RSI declines from overbought territory below the 70-overbought trigger level.

In theory, the crossover strategy could prevent a trader from purchasing when the market is diving and selling on a sharp rally. Traders would want to avoid a situation where they are buying when the RSI hits 30, just to see the RSI then tumble to 10.

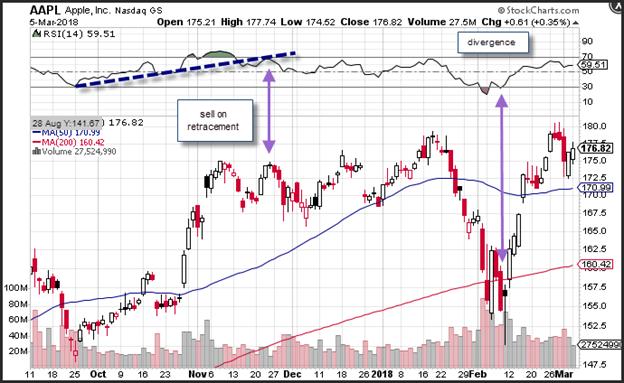
For illustrative purposes only. Apple share price 6-month chart from October 2017- March 2018. Source: StockCharts.com

RSI breakdown/breakout strategy

Support and resistance​​ levels on the RSI could help determine situations where negative or positive momentum is accelerating. In the chart above, the RSI broke down through the trendline​​ support. When the RSI moved higher back to the trend line, it offered an opportunity to short sell Apple shares.

RSI divergence

Divergence occurs when momentum is moving in one direction, but prices are moving in another. In this scenario, prices would continue to slide or rally, but the RSI would fail to confirm that momentum is increasing in the direction of the trend. Decelerating momentum could indicate that the trend is about to consolidate.

This scenario could provide many types of trading opportunities. For example, in the Apple chart, the purple arrow shows a situation where prices hit a new lower low but the RSI does not make a lower low. Prices are still on the decline, but negative momentum has decelerated. The reverse could also occur, where prices are breaking out, but the RSI fails to make fresh highs. This reflects a situation where positive momentum is decelerating.

Importance of relative strength index

The RSI is an important technical analysis methodology and one that many traders will use as part of their trading strategy. It is a versatile technical analysis tool and is most effective when combined with another method. For example, it can be used in conjunction with Bollinger Bands to determine if a security is stretched too far. Support and resistance levels measured by moving averages or trendlines can also be used to find levels where the market is oversold and finds support, or overbought and finds resistance.

Open an account to get started trading with the RSI indicator. You will automatically be granted access to a free demo account, where you can practise with virtual funds.