Forex candlestick patterns
Forex candlestick patterns are a form of charting analysis used by forex traders to identify potential trading opportunities. This is based on historical price data and trends. When used in conjunction with other forms of technical and fundamental analysis, forex candlestick patterns can offer valuable insight into possible trend reversals, breakouts and continuations in the forex market.
Japanese candlesticks were first invented in Japan in the 18th century and have been used in the western world as a method of analysing the financial markets for well over a century. In particular, they are commonly used for forex trading. They rely on past price action to forecast future price movements.
Forex candlestick patterns are fairly visual compared to other forms of technical analysis and offer information on open, high, low and close prices for the financial instrument you wish to trade.
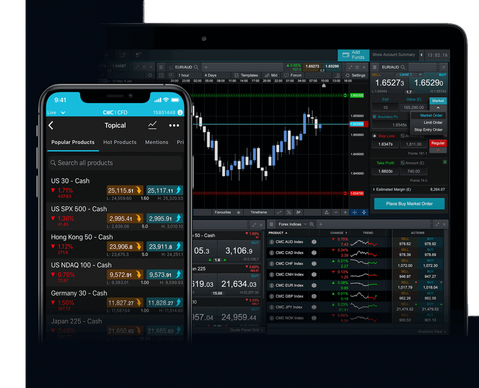
See inside our platform
Get tight spreads, no hidden fees and access to 12,000 instruments.
Start trading
Includes free demo account

What is a candlestick in forex trading?
Forex candlesticks are especially useful in offering insight into the short-term price movements of the markets, making them a valuable tool for forex day trading strategies. In a typical Japanese candlestick chart, each candlestick represents the open, high, low and close prices of a given time period for a currency pair.
For instance, in a daily candlestick chart for EUR/USD, the wick or shadow at the top of the candlestick would show the highest level prices reached on that day, while the wick or shadow at the bottom of the candlestick would show the lowest level prices reached on that particular day.
The formation of a candlestick requires the open, high, low and close prices of a specific period. For example, a trader would need the daily, open, high, low and close price to generate a daily candlestick. This would be the same for either a weekly or monthly candlestick. For the candlestick to be successfully evaluated, you would need to wait for the closing price of a session.
How to read candlesticks in forex trading
The body of the candlestick indicates the difference between the opening and closing prices for the day. Candlesticks are generally coloured, as it makes it easier to see whether the candlestick is bullish or bearish. The body of the candlestick is hollow, and the areas above and below the body are called shadows.
A coloured candlestick (usually indicated by black or red) would indicate that the closing price was lower than the opening price, while a candlestick with a transparent body (also usually indicated by white or green) would show that the closing price was higher than the opening price for that day.
Forex candlestick patterns strategy
Candlestick reversal patterns in forex can help traders to identify trend reversals, breakouts and continuations when monitoring currency pairs. This provides signals for traders to modify their positions, short sell or add extra stop-losses in order to avoid capital loss. Technical analysis is used to determine uptrends and downtrends within the FX market, by drawing support lines on candlestick graphs.
Best forex candlestick patterns
There are over 40 recognised forex candlestick chart patterns in total. Below is a list of eight of the best candlestick patterns to spot in forex trading:
Trade on 330+ currency pairs
Marubozu
BLACK MARUBOZU
Black marubozus are significant candlestick patterns that give valuable insight into selling pressure. Black marubozus are rectangular candlesticks with little or no shadow at the top or bottom. These indicate selling pressure in a market and show that bears were calling the shots from the opening bell until the closing bell on the day. A marubozu trading strategy is especially valuable for significant support and resistance levels and may indicate that a potential price level is about to be hit.
WHITE MARUBOZU
White marubozus are similar to their black counterparts, but they indicate that prices are being controlled by buying pressure. These are rectangular blocks with very little or virtually no shadows at the top or bottom. White marubozus most commonly indicate continuation in an uptrend, while in a downtrend they can indicate that a potential trend reversal could occur.
Doji
Doji, or crosses, are usually made up of a single candlestick and they show that the opening and closing price of a candlestick is virtually the same. Doji candles resemble crosses or inverted crosses, or plus signs. In technical analysis, dojis usually represent neutrality, meaning that the trend is likely to continue. The shadows or wicks on a doji are an important indicator of market sentiment. For example, if the shadow at the top of the candlestick is long, it means that investors tried to push the price higher, but failed, while a longer shadow at the bottom indicates the presence of selling pressure.
Engulfing pattern (bullish/bearish)
Engulfing candlestick patterns (bullish/bearish market) signify a potential reversal in trend and are indicated by a large candlestick extending higher and lower than (literally engulfing) the previous candlestick. The larger the size of the engulfing candlestick, the more significant it is to analysts. A black engulfing candlestick represents a potential bearish reversal during an uptrend, while a white engulfing candlestick could indicate that a bullish reversal is about to occur in a downtrend. Read more about how to trade the bear market.
Hammer
A common bullish reversal pattern, hammers indicate that an uptrend is likely to occur. As the name suggests, hammer candlesticks have a short body, with a shadow or wick that is twice as long at the bottom. When the high and close are the same, it indicates the formation of a bullish candlestick pattern, meaning that while bears tried to push prices lower, buying pressure from the bulls pushed up prices, with prices eventually closing at the same level as the day's high. Hammers candlestick patterns where the open is the same as the high are considered less bullish, but indicate a possible bullish trend nevertheless.
Shooting star
Shooting stars look a lot like inverted hammers from above and indicate that a bearish reversal is about to occur. Shooting star candlesticks are created when the low, open and close of the day are close to each other, with the day's high located high above, forming at least twice the length of the body of the candlestick. When the low and closing prices are the same, a shooting star is considered more significant as it indicates that bulls tried to push prices higher but were overpowered by the bears, and prices eventually closed at a similar level to where they opened. Shooting star candlestick chart patterns can sometimes look like a gravestone doji.
Three-line strike
The three-line strike pattern refers to three white candlesticks occurring on a daily chart timeframe three days in a row, indicating that prices closed higher for three simultaneous days. Three-line strikes usually occur at the end of a downtrend and may, therefore, indicate that a reversal might be in order.
Three black crows
Three-black crows are a common reversal forex indicator in an uptrend and are indicated by three black consecutive candlesticks on a daily chart where the closing prices were lower than the opening price of the day. Formed of three consecutive black candlesticks with long bodies, these indicate the lack of buying conviction in the market, which allowed bears to successfully push prices lower.
Evening star
Evening star candlestick patterns usually occur at the top of an uptrend and signify that a trend reversal is about to occur. Evening stars consist of three candlesticks, with the first candlestick having a significantly large green or white body, indicating that prices closed higher than the opening level. The second candlestick opens higher after a gap, meaning that there is continued buying pressure in the market. The second candlestick in an evening star pattern is usually small, with prices closing lower than the opening level. The third and final evening star candlestick opens lower after a gap and signifies that selling pressure reversed gains from the first day's opening levels.
Understanding forex candlestick patterns
When used in conjunction with other forms of analysis, candlestick patterns can be a useful indicator of potential trend reversals and price breakouts in the market, helping you to build a stronger and more effective forex trading strategy.
So, what are the risks of trading with a forex candlestick patterns strategy? When trading the financial markets, you are constantly exposed to market risk. While trading following patterns and studies, traders should always be aware of the potential risk of algorithmic trading. This uses information at the speed of light and can alter the landscape at any time using data that might not be available to the trader.
Therefore, it is important that you consider risk management prior to entering any trades. Similar to other systems of trading, you will need to have an idea of where to stop out and where to take profits before you enter a trade. We also recommend that forex traders take stop-loss orders into consideration, as trading with leverage can maximise profits, but can equally maximises losses.

Powerful trading on the go
Seamlessly open and close trades, track your progress and set up alerts
How to use candlesticks in forex trading
Our award-winning trading platform, Next Generation, comes with a wide range of Japanese candlestick patterns that traders are able to draw on, customise and use to improve their trading strategy within the forex market. Take a look at our new charting features here.
Drawing tools, technical indicators and price projection tools are also available for traders on-the-go with our mobile trading app. This applies to both Android and iOS users, so you can start perfecting your forex candlestick pattern strategy straight away.
- Open a live account to get started in the forex market
- Open a demo account to practise trading risk-free with virtual funds
See why serious traders choose CMC
Get tight spreads, no hidden fees, access to 12,000 instruments and more.
FCA regulated
Segregated funds
Learn more
Includes free demo account