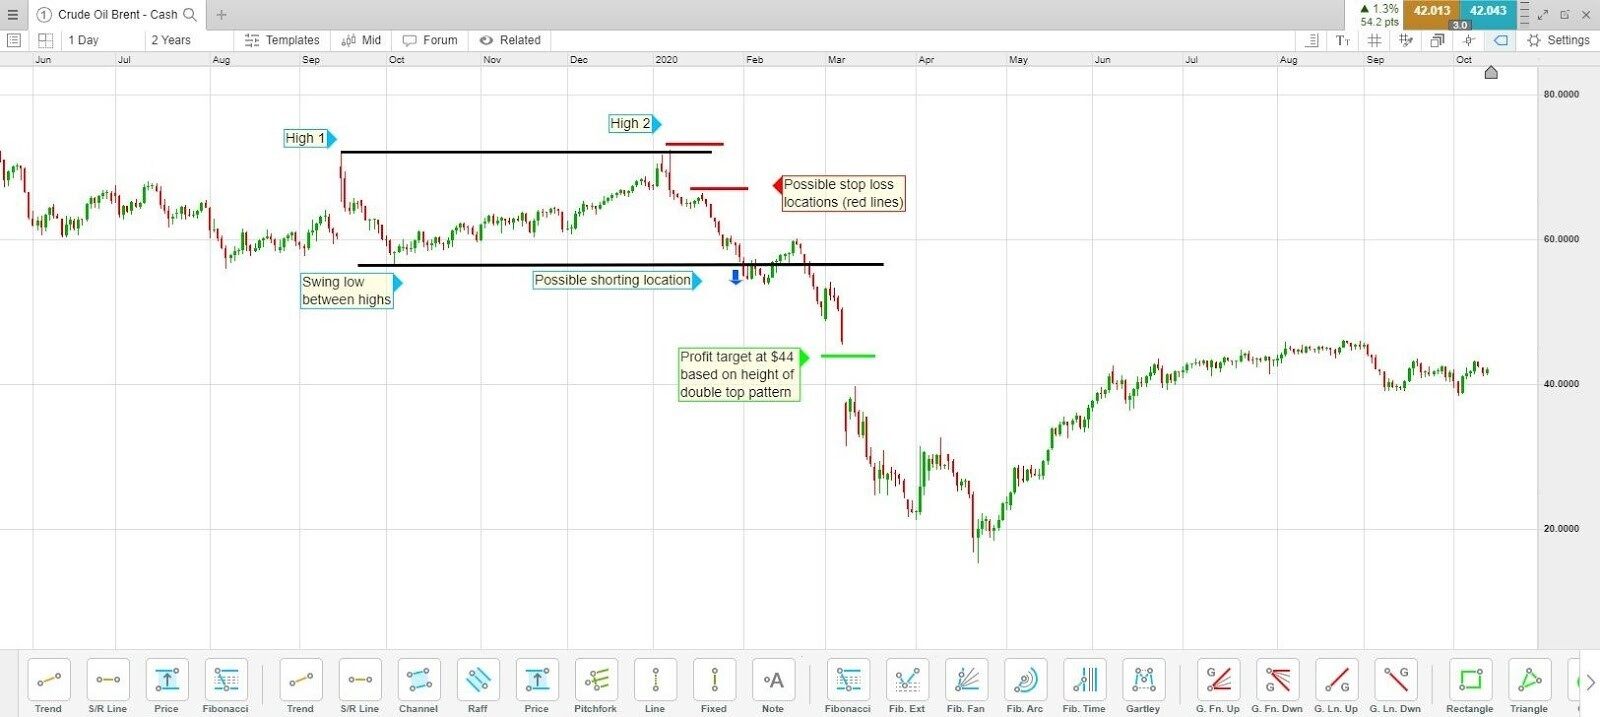
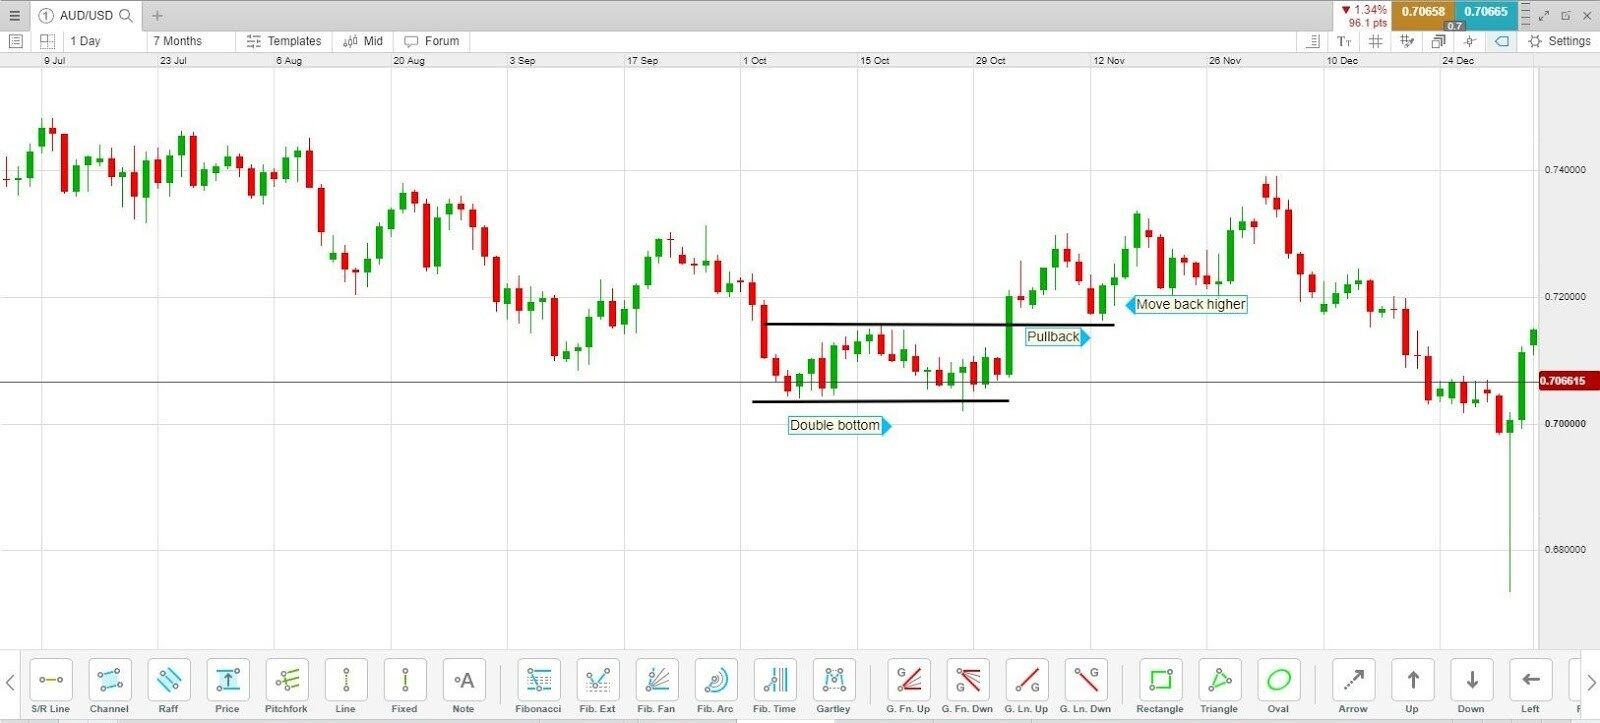
A double top is a candlestick pattern that forms when the price on a candlestick chart makes a high, pulls back forming a swing low and then moves back to near the prior high. The pattern is complete, indicating a bearish reversal when the price drops below the swing low formed between the two peaks.
Candlestick charts are commonly used because they show the high and low for each price bar or candle. Until the price falls below the swing low between the peaks, the double top pattern is still forming and this does not necessarily indicate a trend reversal. The price could still move above the highs. Below is an example of a double top on a Brent Crude oil price chart.
