Through a unique partnership with BETA Financial and RRG® Research, CMC have developed an all-new trading product, powered by institutional-level technology - RRG® UK Momentum+. The CFD portfolio is made up of 10 equally-weighted shares, tracking strong, relative momentum in the FTSE 350, updated quarterly. RRG’s founder and co-creator of RRG® UK Momentum+, Julius de Kempenaer, talks through the portfolio’s very first rebalance.
At the start of Q3-2020 the RRG® UK Momentum+ basket held the following constituents:
GAW, WMH, FUTR, OCDO, RWS, RMG, GYS, AVON, PETS, JD/
This was the composition of the basket when it started trading on 2 December.
Going into the first rebalance since the instrument’s inception, our scan surfaced 128 stocks that met the initial criteria for inclusion. As per our methodology, this group of 128 names was then ranked based on their JdK RS-Ratio values to determine the final constituents for the basket.
This resulted in the following constituents going into Q1 of 2021:
WEIR, SYNT, AAF, OSB, CRST, FGP, VMUK, TIFS, NtWG, MGGT.
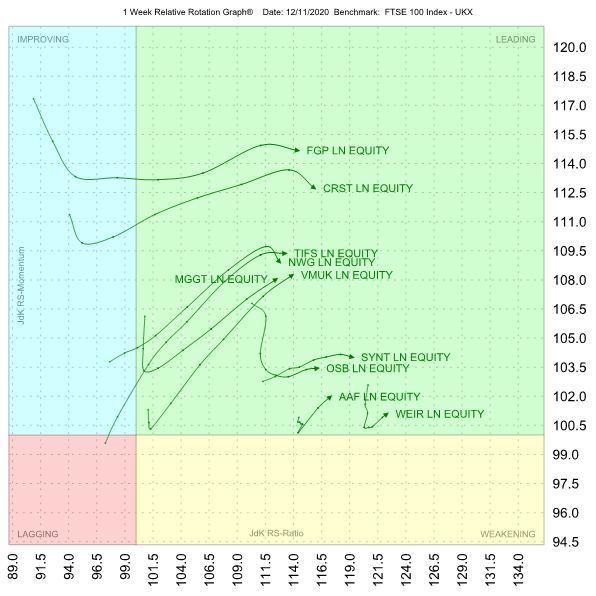
The chart below is the Relative Rotation Graph® (RRG®) for these ten names.

As you can see, all are located inside the leading quadrant on the RRG, which means they are in relative uptrends against the UK100 index, and these trends are still being pushed higher by positive momentum.
Also, these stocks are showing in general, what’s called, a positive RRG-Heading between 0-90 degrees. In other words, they are travelling in a North-Eastern direction, which is one of the criteria for inclusion in the portfolio. The RRG-Heading is the vector at which the tail moves measured from a previous observation, to the current observation.
This group of stocks will drive the RRG® UK Momentum+ basket in the first quarter of 2021.
The consituents
Looking at some of the individual charts from this group we can see that on the RRG chart, WEIR group shows a “hook” back into a positive RRG-Heading, which put it back on the map for inclusion in the basket. The normal rotation is clockwise but when it moves very fast this can show up as a counter-clockwise move like this one. Moving to a shorter timeframe (in this case from a weekly RRG to a daily RRG) would reveal the underlying clockwise nature of the rotation.
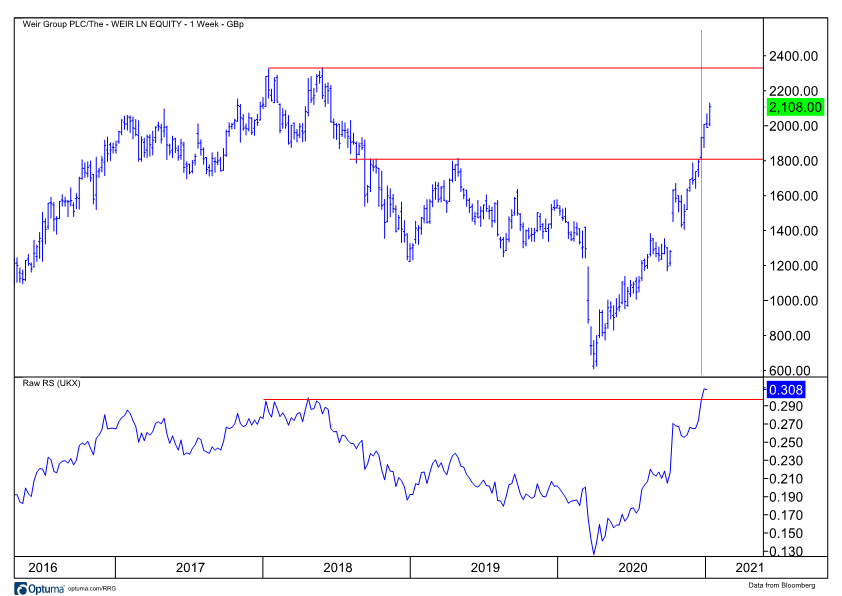
The price chart of WEIR below shows the strength of the current trend in terms of both price and relative strength (the lower pane).

An interesting observation is the fact that the relative strength line (WEIR vs UK100) has already broken its 2018 highs while price still needs to do that. That GBP 2300 level is expected to act as resistance on the way up. An upward break will very likely add new fuel to the rally and push WEIR to higher prices.
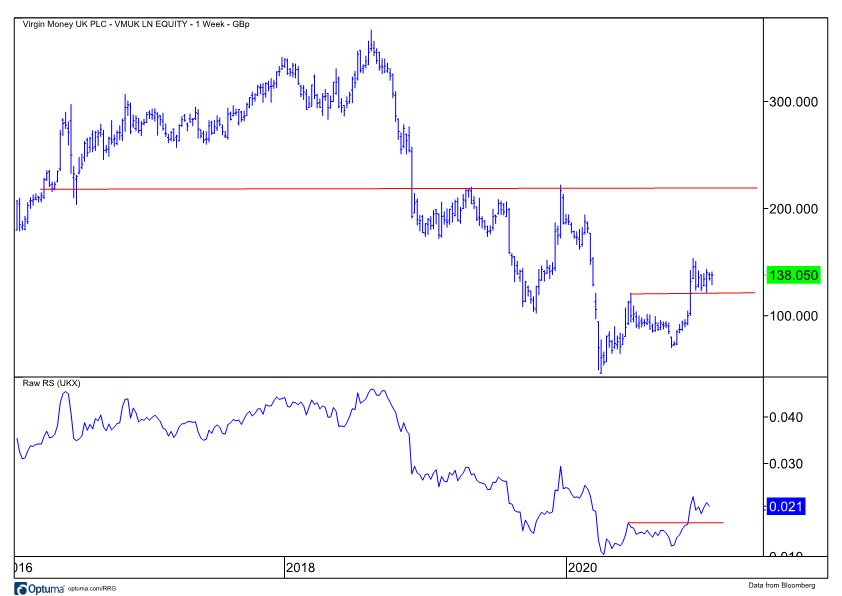
The chart of Virgin Money UK shows a structure similar to NWG, MGGT, and CRST’s charts.

All these stocks went through a significant decline and bottomed out at the start of 2020, put in a first higher low and are now breaking their previous high, which signals the start of a new uptrend (higher highs and higher lows).
In combination with an upward reversal in relative strength against the UK100 this positions them inside the leading quadrant at a strong RRG-Heading, with an expectation for further improvement.
Disclaimer Past performance is not a reliable indicator of future results.
CMC Markets is an execution-only service provider. The material (whether or not it states any opinions) is for general information purposes only, and does not take into account your personal circumstances or objectives. Nothing in this material is (or should be considered to be) financial, investment or other advice on which reliance should be placed. No opinion given in the material constitutes a recommendation by CMC Markets or the author that any particular investment, security, transaction or investment strategy is suitable for any specific person.
The material has not been prepared in accordance with legal requirements designed to promote the independence of investment research. Although we are not specifically prevented from dealing before providing this material, we do not seek to take advantage of the material prior to its dissemination.
CMC Markets does not endorse or offer opinion on the trading strategies used by the author. Their trading strategies do not guarantee any return and CMC Markets shall not be held responsible for any loss that you may incur, either directly or indirectly, arising from any investment based on any information contained herein.
*Tax treatment depends on individual circumstances and can change or may differ in a jurisdiction other than the UK.
Continue reading for FREE
- Includes free newsletter updates, unsubscribe anytime. Privacy policy


